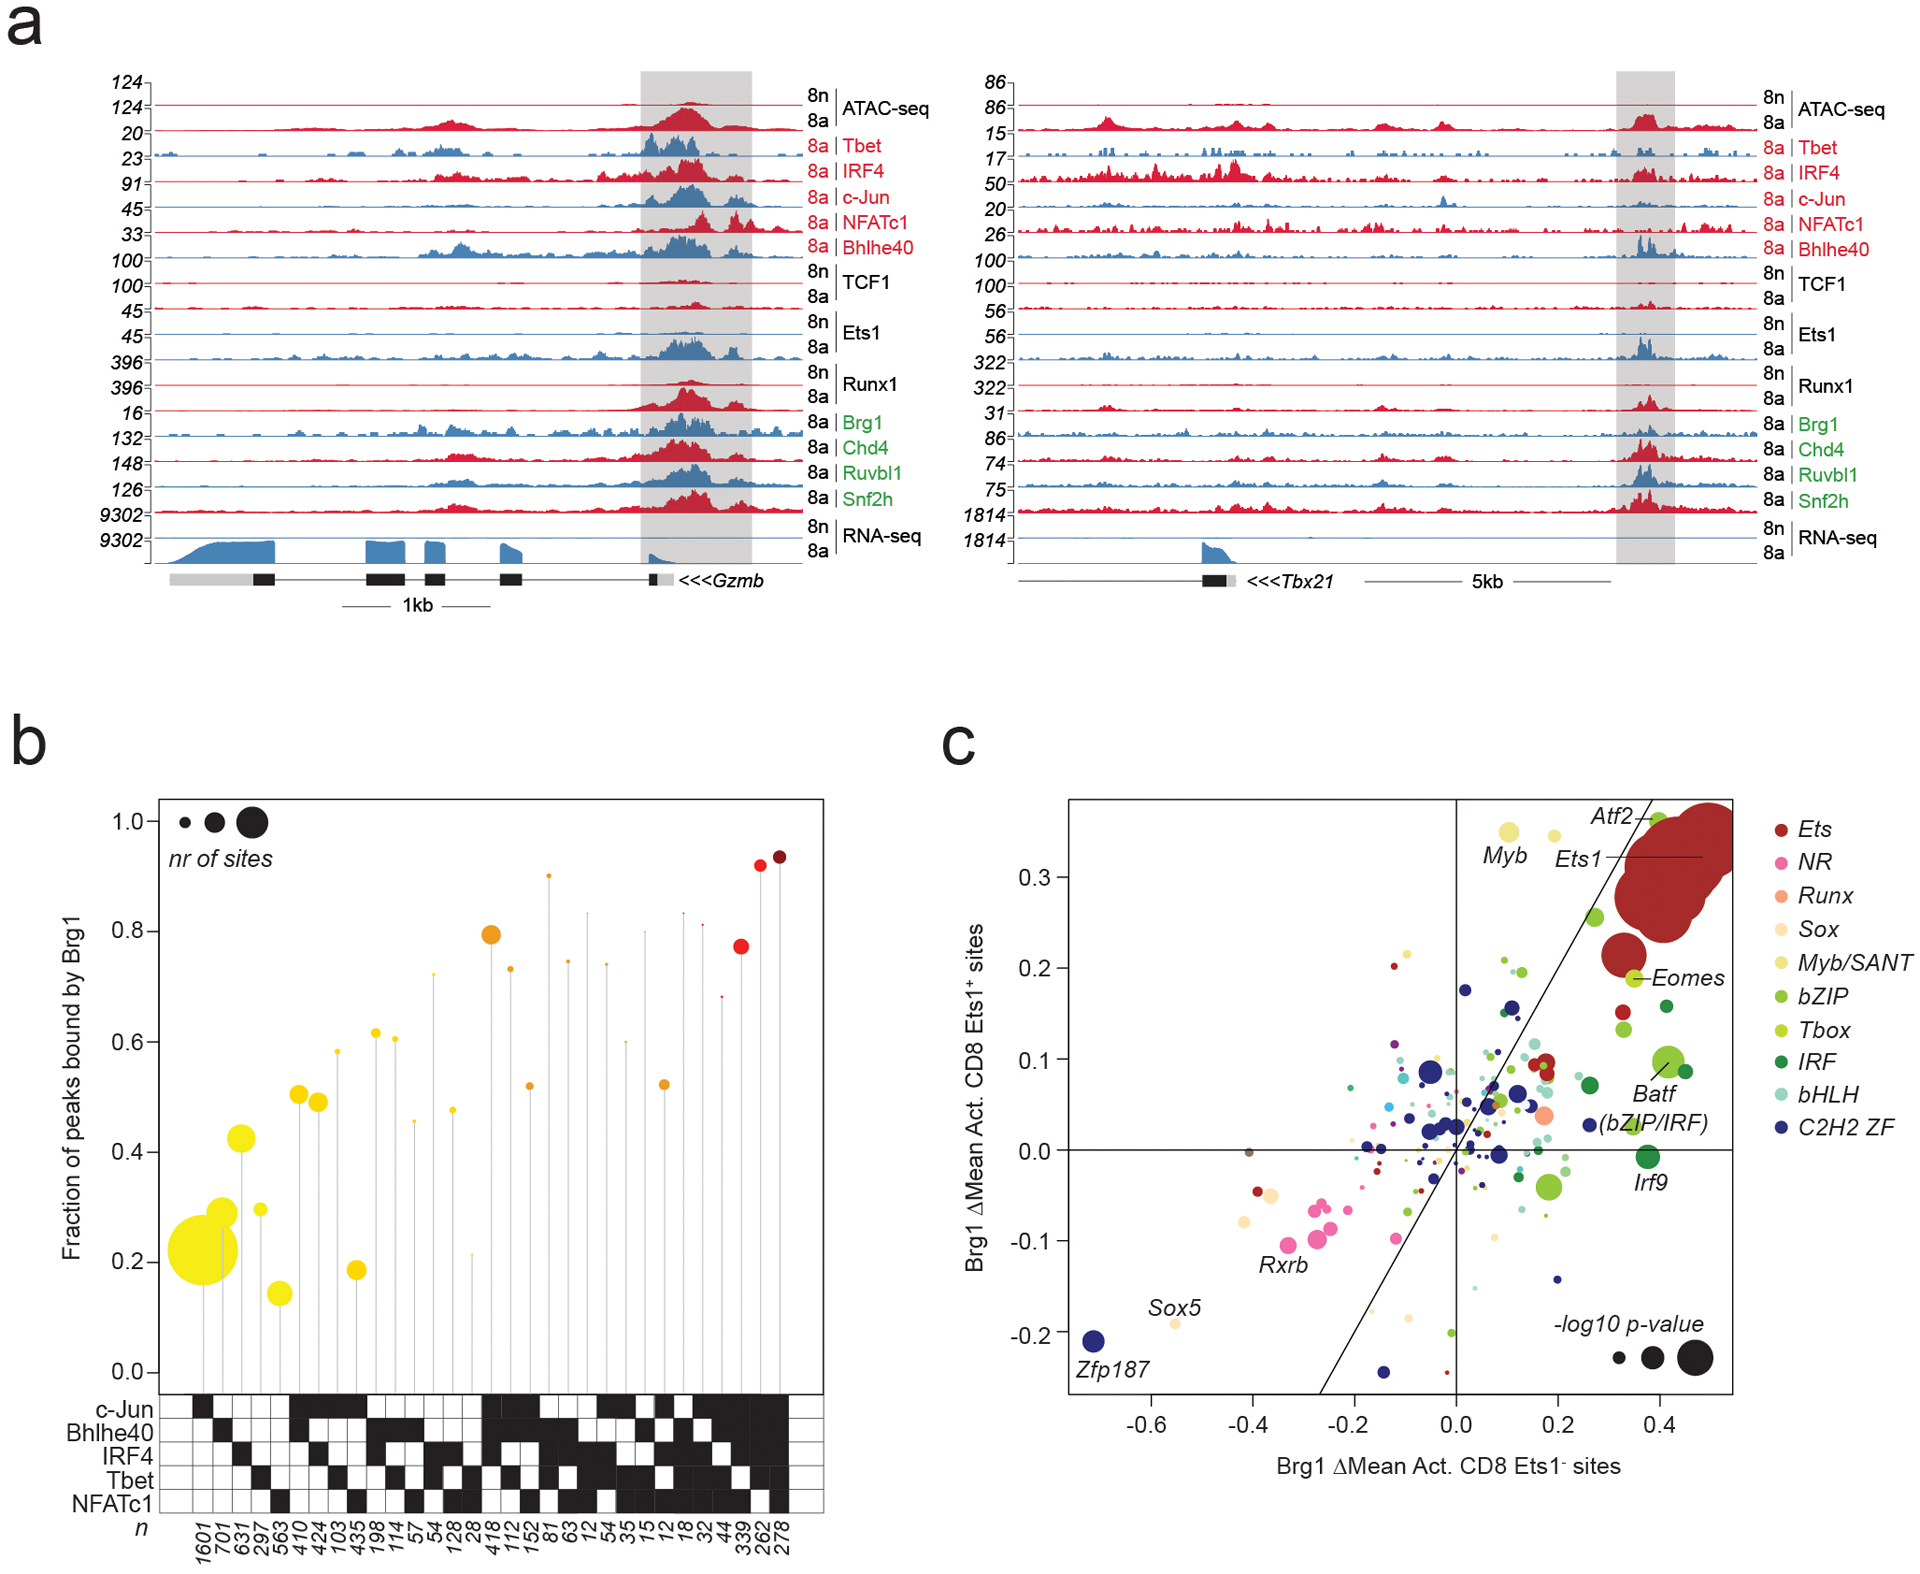
Extended Data Fig. 4. TF and cofactor binding at Ets1-bound and –unbound chromatin regions.

a: Gene tracks of RNA-seq, ATAC-seq and CUT&RUN coverage at the Gzmb and Tbx21 loci in naïve and activated CD8 T cells.
b: Fraction of peaks bound by Brg1 at Ets1-unbound ATAC-seq peaks occupied by distinct combinations of activation-induced TFs. Data points are scaled according to the number of peaks in each set.
c: Effect of TF binding motif variants on Brg1 occupancy at Ets1-bound (Ets1+) and Ets1-unbound (Ets1−) sites measured as ΔMean in activated CD8 T cells. Data points are colored by TF family and scaled according to the −log10 p-value of a t-test comparing the allelic ratios between peaks with stronger motif matches on the B6 vs Cast allele. The most significant p-value obtained across the two cell types (naïve and activated CD8) was used for scaling.
