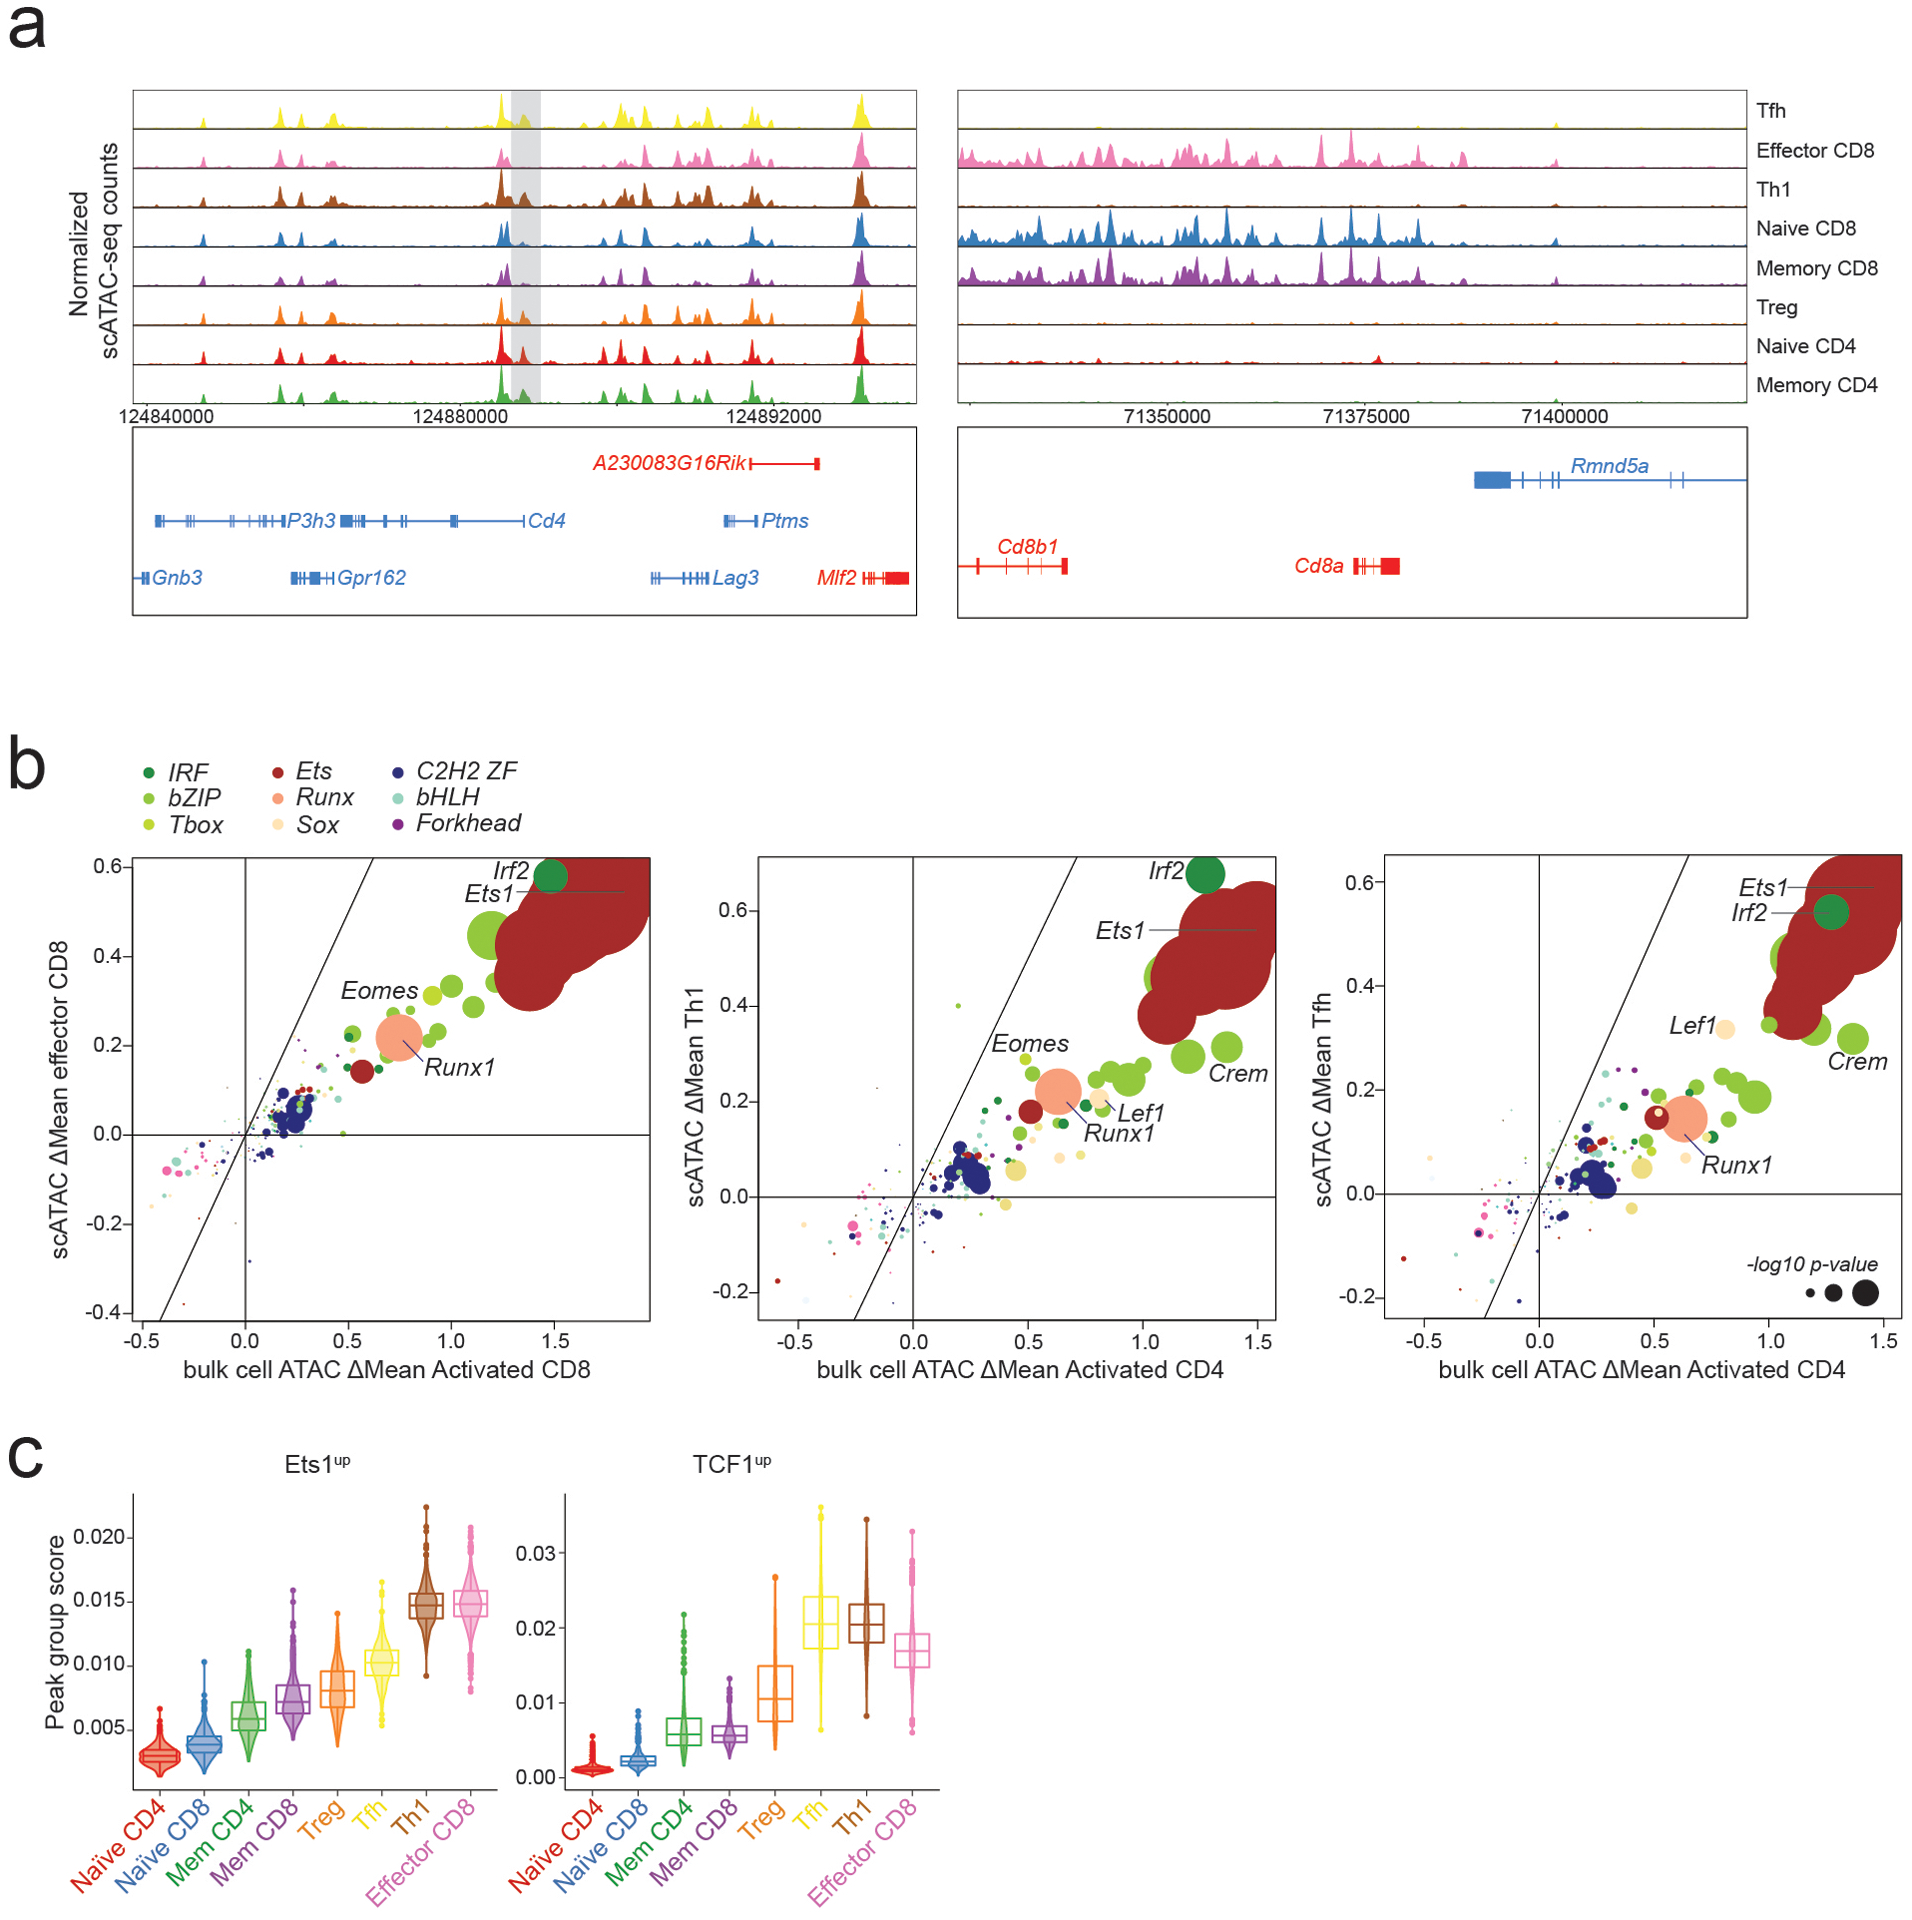
Extended Data Fig. 6. Single cell ATAC-seq analysis of T cell subsets during acute LCMV infection.

a: Pseudo-bulk scATAC-seq tracks showing chromatin accessibility at CD4 and CD8 loci across splenic cell populations in LCMV infected (B6/Cast) F1 mice.
b: Effect of genetic variation in TF binding motifs on allele-specific ATAC-seq counts from bulk cell or single cell experiments. Data points are colored by TF family and scaled according to the −log10 p-value of a two-sided t-test comparing the allelic ratios between peaks with stronger matches on B6 vs Cast Allele.
c: Violin plots and box plots showing accessibility of indicated peak groups across T cell subsets. The center line in the box plots represents the median, the box limits represent the 25th and 75th percentiles, and the whiskers are the minimum/maximum values within 1.5 times the interquartile range. n = the number of cells in each cell annotation (420 Naïve CD4, 344 Naïve CD8, 234 Mem CD4, 231 Mem CD8, 198 Treg, 1321 Tfh, 652 Th1, 2583 Effector CD8)
