
Fig. 2: Runx1, TCF1 and Ets1 occupy the majority of accessible chromatin regions.
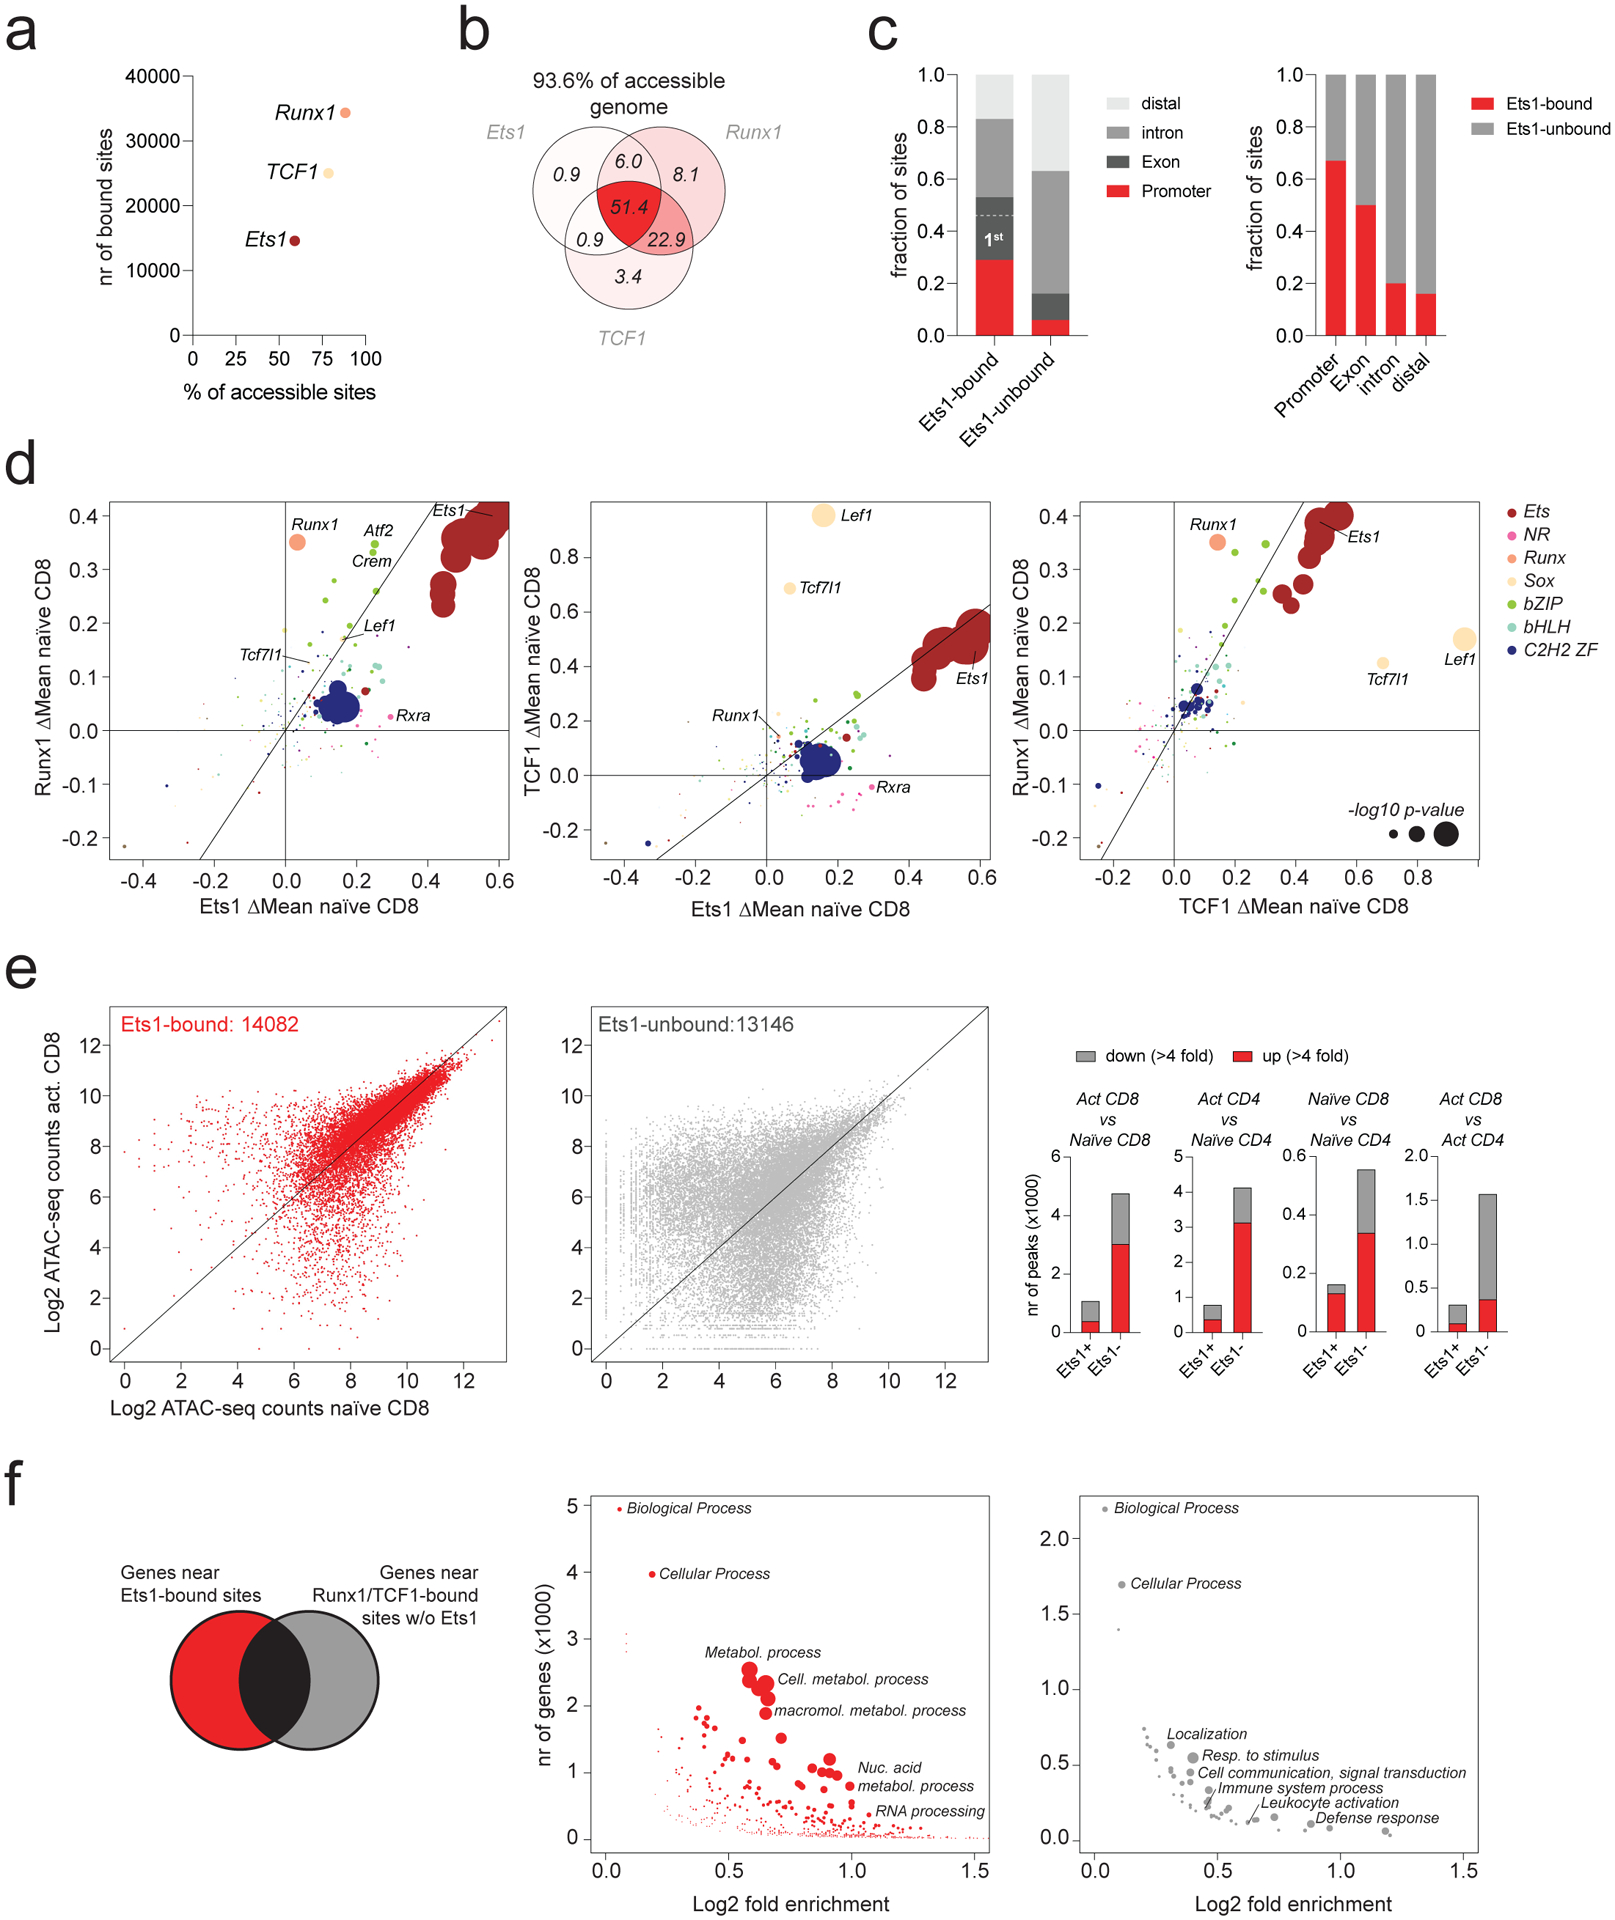
a: Runx1, TCF1, and Ets1 binding in naïve CD8 T cells measured by CUT&RUN. The number of ATAC-seq peaks bound by each TF is shown, together with the fraction of all accessible peaks (>100 ATAC-seq reads in naïve T cells) that is bound by each factor.
b: The fraction of all accessible peaks (>100 ATAC-seq reads in naïve T cells) that is bound by each combination of Runx1, TCF1, and Ets1.
c: Composition of Ets1-bound and –unbound regulatory elements (left). Fraction of ATAC-seq peaks overlapping with promoters, exons, introns, and distal elements bound by Ets1 (right).
d: Effect of genetic variation in TF-binding motifs on allelic bias in Runx1, Ets1, and TCF1 binding in naïve T cells. Data points are colored by TF family and scaled according to the −log10 p-value of a two-sided t-test comparing the allelic ratios between peaks with stronger matches on the B6 vs Cast allele.
e: Chromatin accessibility at ATAC-seq peaks bound by TCF1 or Runx1 with (Ets1-bound) or without Ets1 (Ets1-unbound) (left). Number of differentially accessible peaks (>100 reads in at least one cell type) across various comparisons (right).
f: GO term enrichment analysis of non-overlapping genes nearest to Ets1-bound vs. unbound peak sets. Data points are scaled according to the FDR.