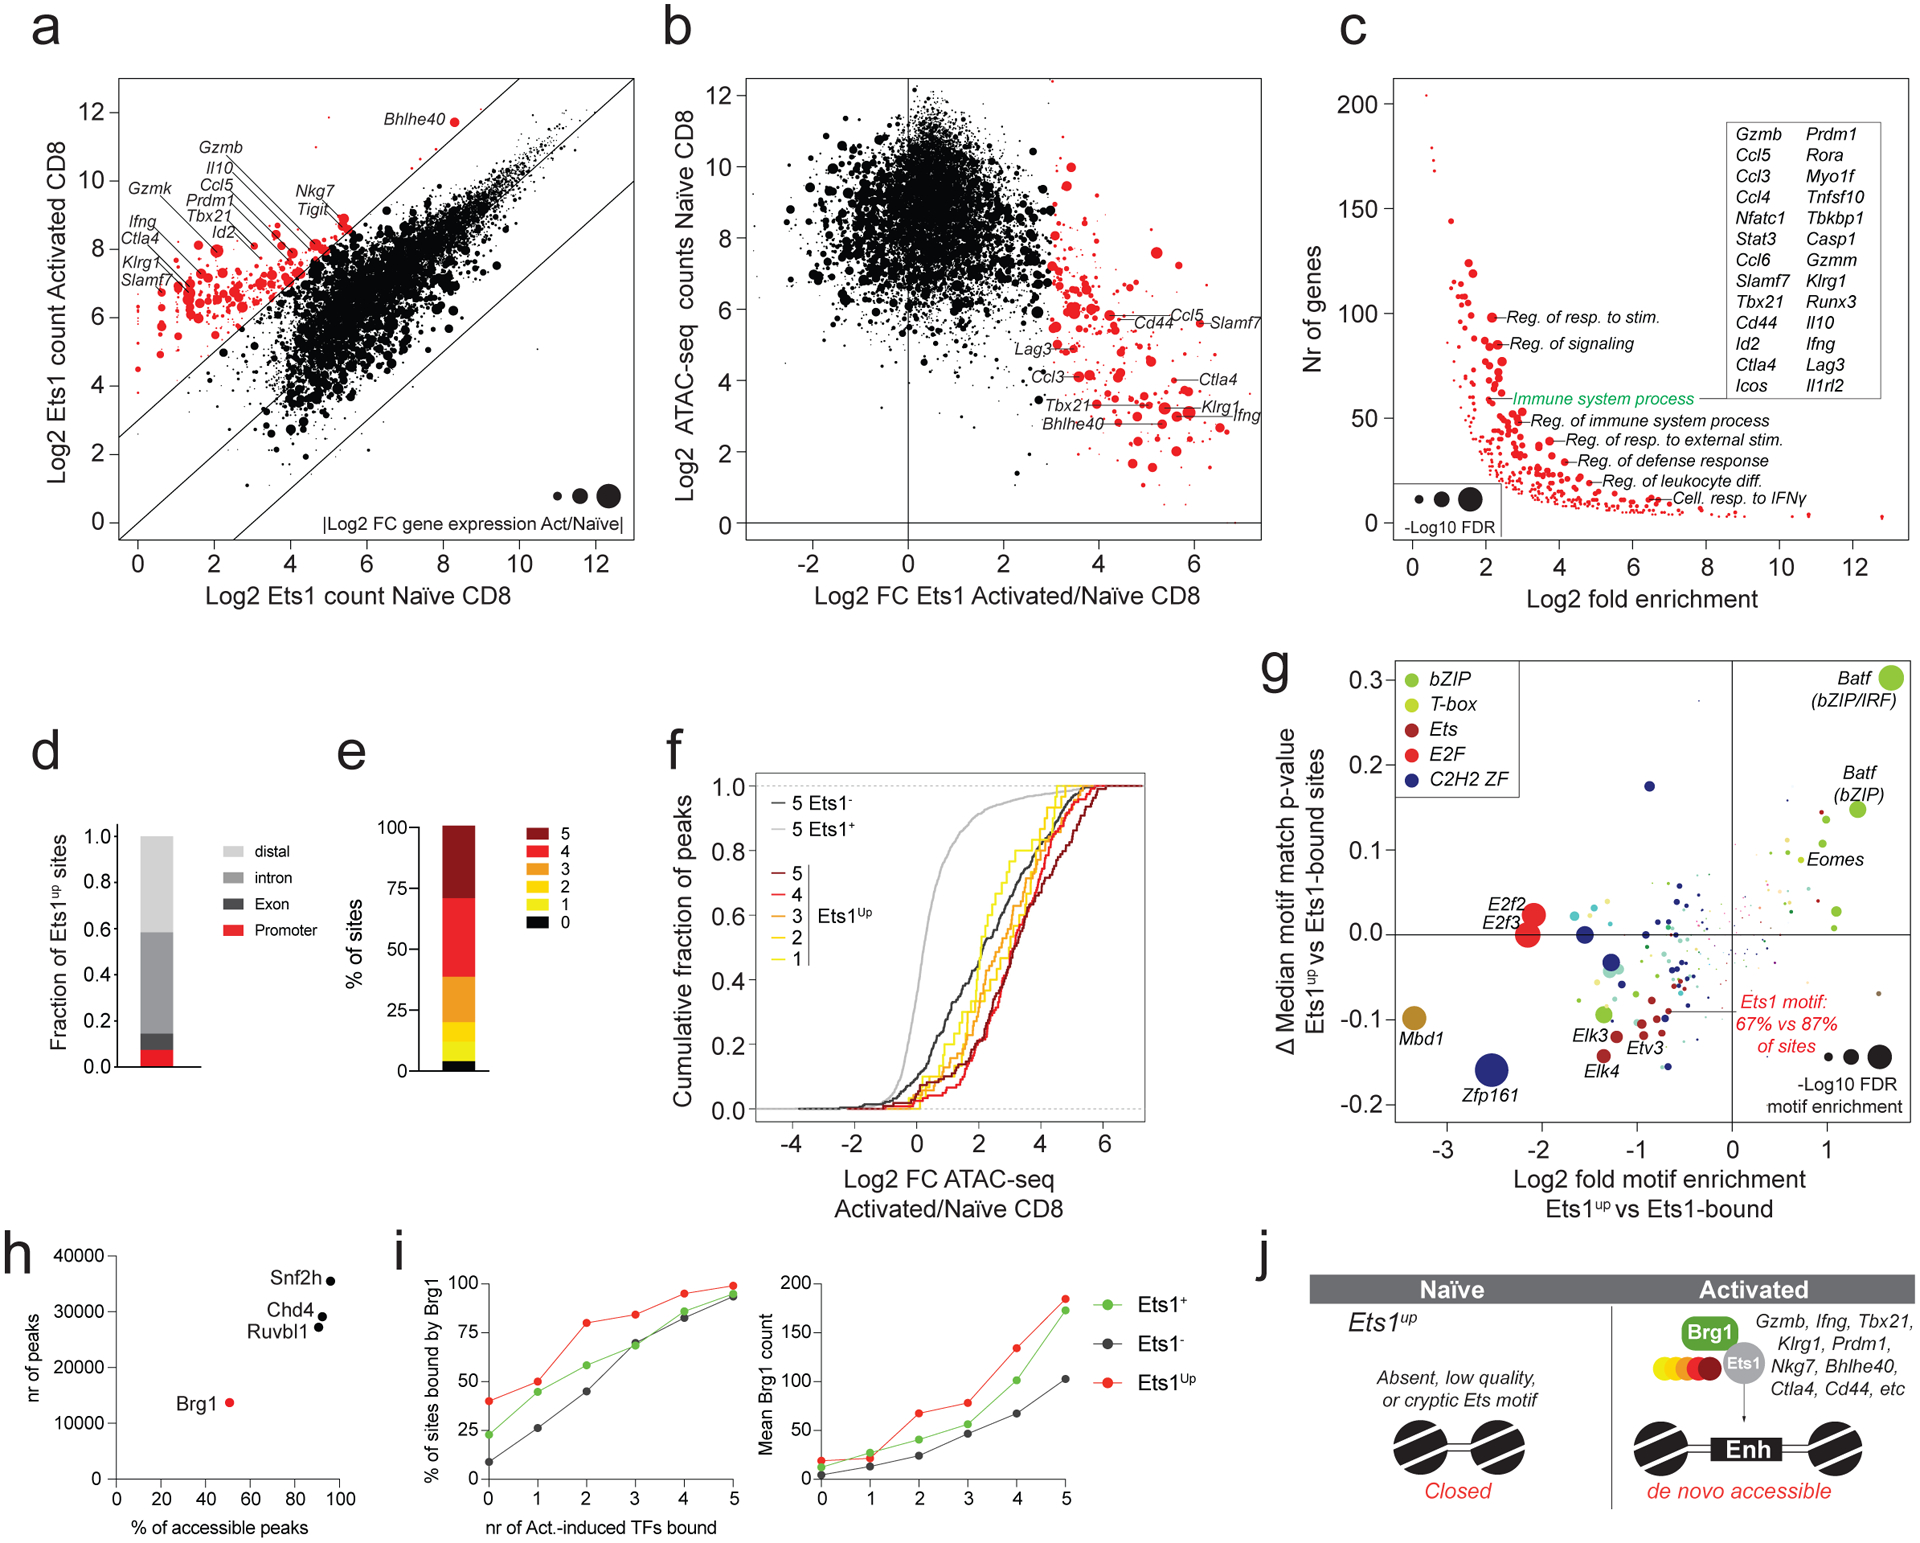
Fig. 4: A small subset of immune response-related elements recruits Ets1 de novo upon T cell activation.

a: Ets1 CUT&RUN counts at ATAC-seq peak regions in naïve and activated CD8 T cells. Data points are scaled according to the absolute log2 fold change in expression of the nearest gene in activated vs naïve CD8 T cells. A subset of peaks with >8-fold more Ets1 binding in activated vs naïve CD8 T cells (Ets1up sites) is highlighted in red.
b: Chromatin accessibility in naïve CD8 T cells plotted against the log2 fold change in Ets1 binding in activated vs naïve CD8 T cells. Ets1up sites are highlighted in red.
c: Gene ontology term enrichment analysis for genes nearest to ATAC-seq peaks gaining Ets1 binding upon T cell activation (red dots in panel a-b).
d: Cis-regulatory element composition of Ets1up sites.
e: Fraction of Ets1up sites bound by 0 to 5 activation-induced TFs.
f: Changes in chromatin accessibility in activated vs naïve CD8 T cells at Ets1up sites bound by 1–5 activation-induced TFs. Ets1-bound (Ets1+) and -unbound (Ets1−) elements co-occupied by 5 activation-induced TFs are shown as a reference.
g: TF binding-motif enrichment and difference in median (ΔMedian) motif match p-value at Ets1up vs Ets1-bound ATAC-seq peaks.
h: Snf2h, Chd4, Ruvbl1, and Brg1 binding measured by CUT&RUN in activated CD8 T cells. The number of ATAC-seq peaks bound by each TF is shown, together with the fraction of all accessible peaks (>100 ATAC-seq reads in activated T cells) that is bound by each factor.
i: Fraction of Ets1-bound (Ets1+), Ets1-unbound (Ets1−) and Ets1up peaks co-bound by 0 to 5 activation-induced TFs that are bound by Brg1 in activated CD8 T cells (left). Mean Brg1 counts at the corresponding peak sets (right).
j: Model of TF activity at Ets1up elements.
