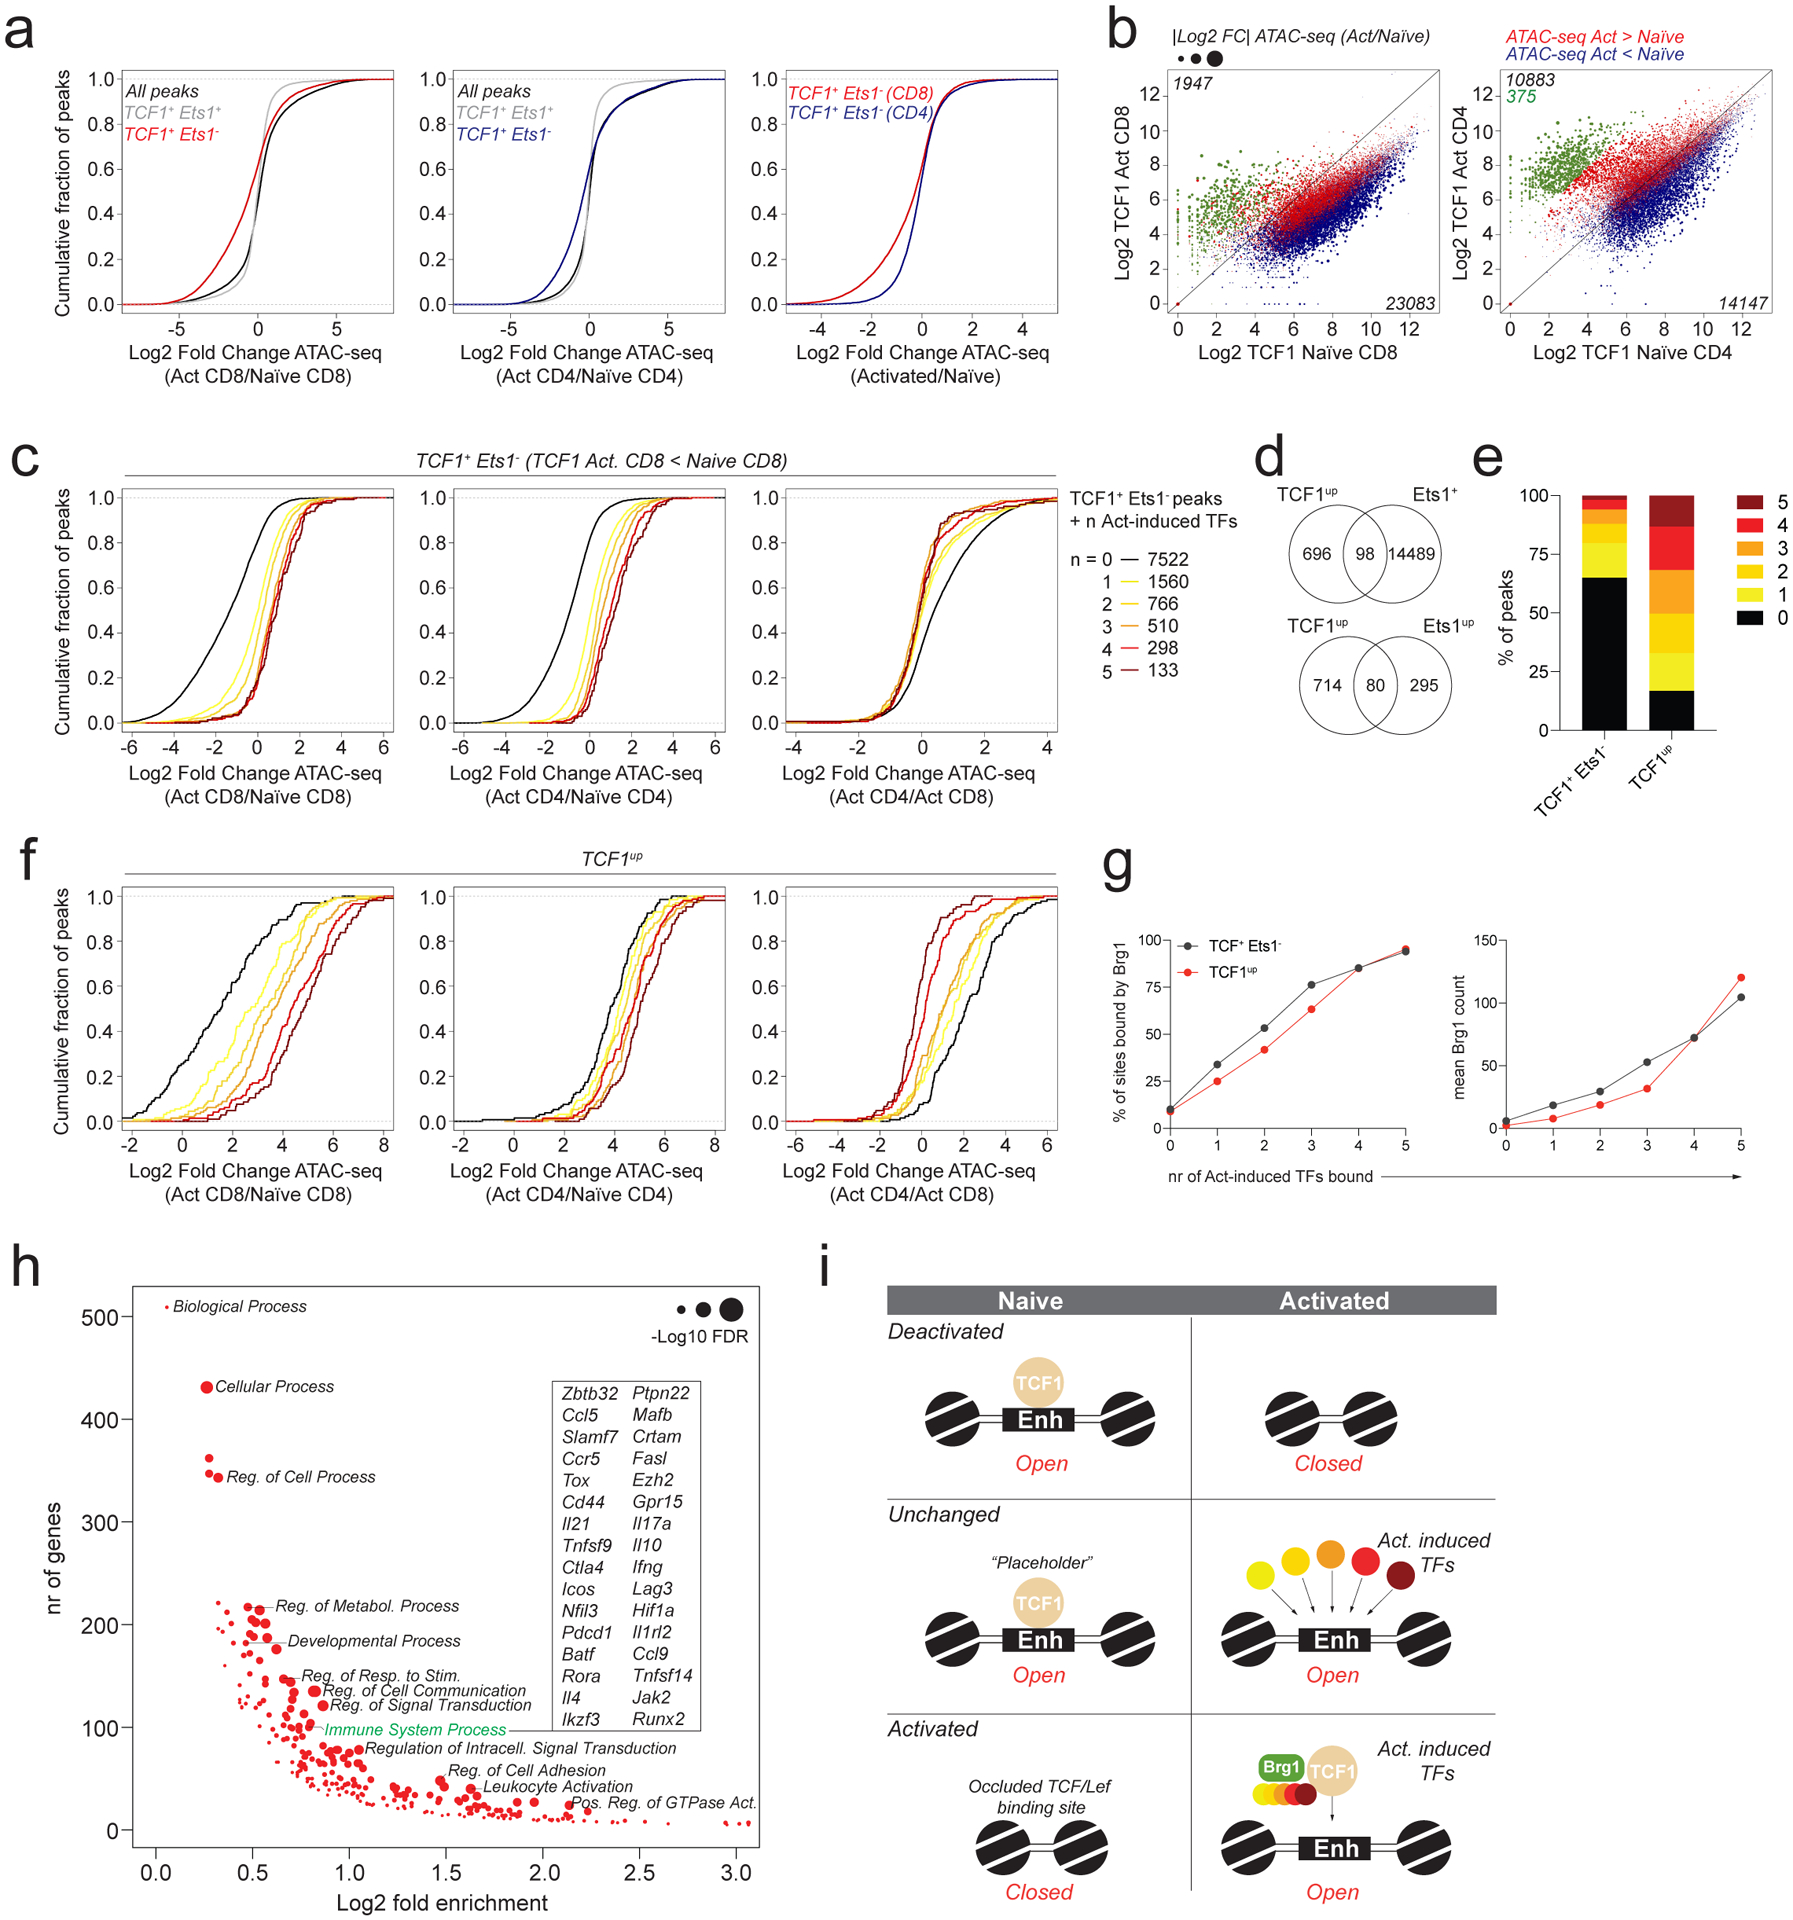
Fig. 6: Context-dependent functions of TCF1 in naïve and activated CD4 and CD8 T cells.

a: Chromatin accessibility changes between naïve and activated CD4 and CD8 T cells at ATAC-seq peaks bound by TCF1 with or without Ets1. All peaks denotes peaks with >100 reads in one or more cell types.
b: TCF1 CUT&RUN signal at ATAC-seq peak regions in naïve and activated CD4 and CD8 T cells. Data points are scaled according to the fold change in chromatin accessibility and colored blue or red according to the directionality of the accessibility change. A subset of peaks that has strong preferential binding of TCF1 in activated T cells was identified in CD4 T cells and highlighted in green.
c: Chromatin accessibility changes between naïve and activated CD4 and CD8 T cells at Ets1+TCF1− ATAC-seq peaks bound by 0–5 activation-induced TFs. Analysis was restricted to peaks with lower TCF1 binding in activated vs naïve CD8 T cells.
d: Overlap between TCF1up peaks (green peaks in panel b) and Ets1-bound ATAC-seq peaks (top) or Ets1up peaks (bottom).
e: Fraction of TCF1+Ets1− peaks and TCF1up peaks bound by 0–5 activation-induced TFs.
f: Chromatin accessibility changes in naïve and activated CD4 and CD8 T cells at TCF1up peaks bound by 0–5 activation-induced TFs.
g: Fraction of TCF1+Ets1− peaks and TCF1up peaks co-bound by 0–5 activation-induced TFs that are bound by Brg1 in activated CD8 T cells (left). Mean Brg1 count at the corresponding peak sets (right).
h: Gene ontology term enrichment analysis for genes nearest to TCF1up peaks (green dots in panel b).
i: Model of TF activity at TCF1-bound regulatory elements.
