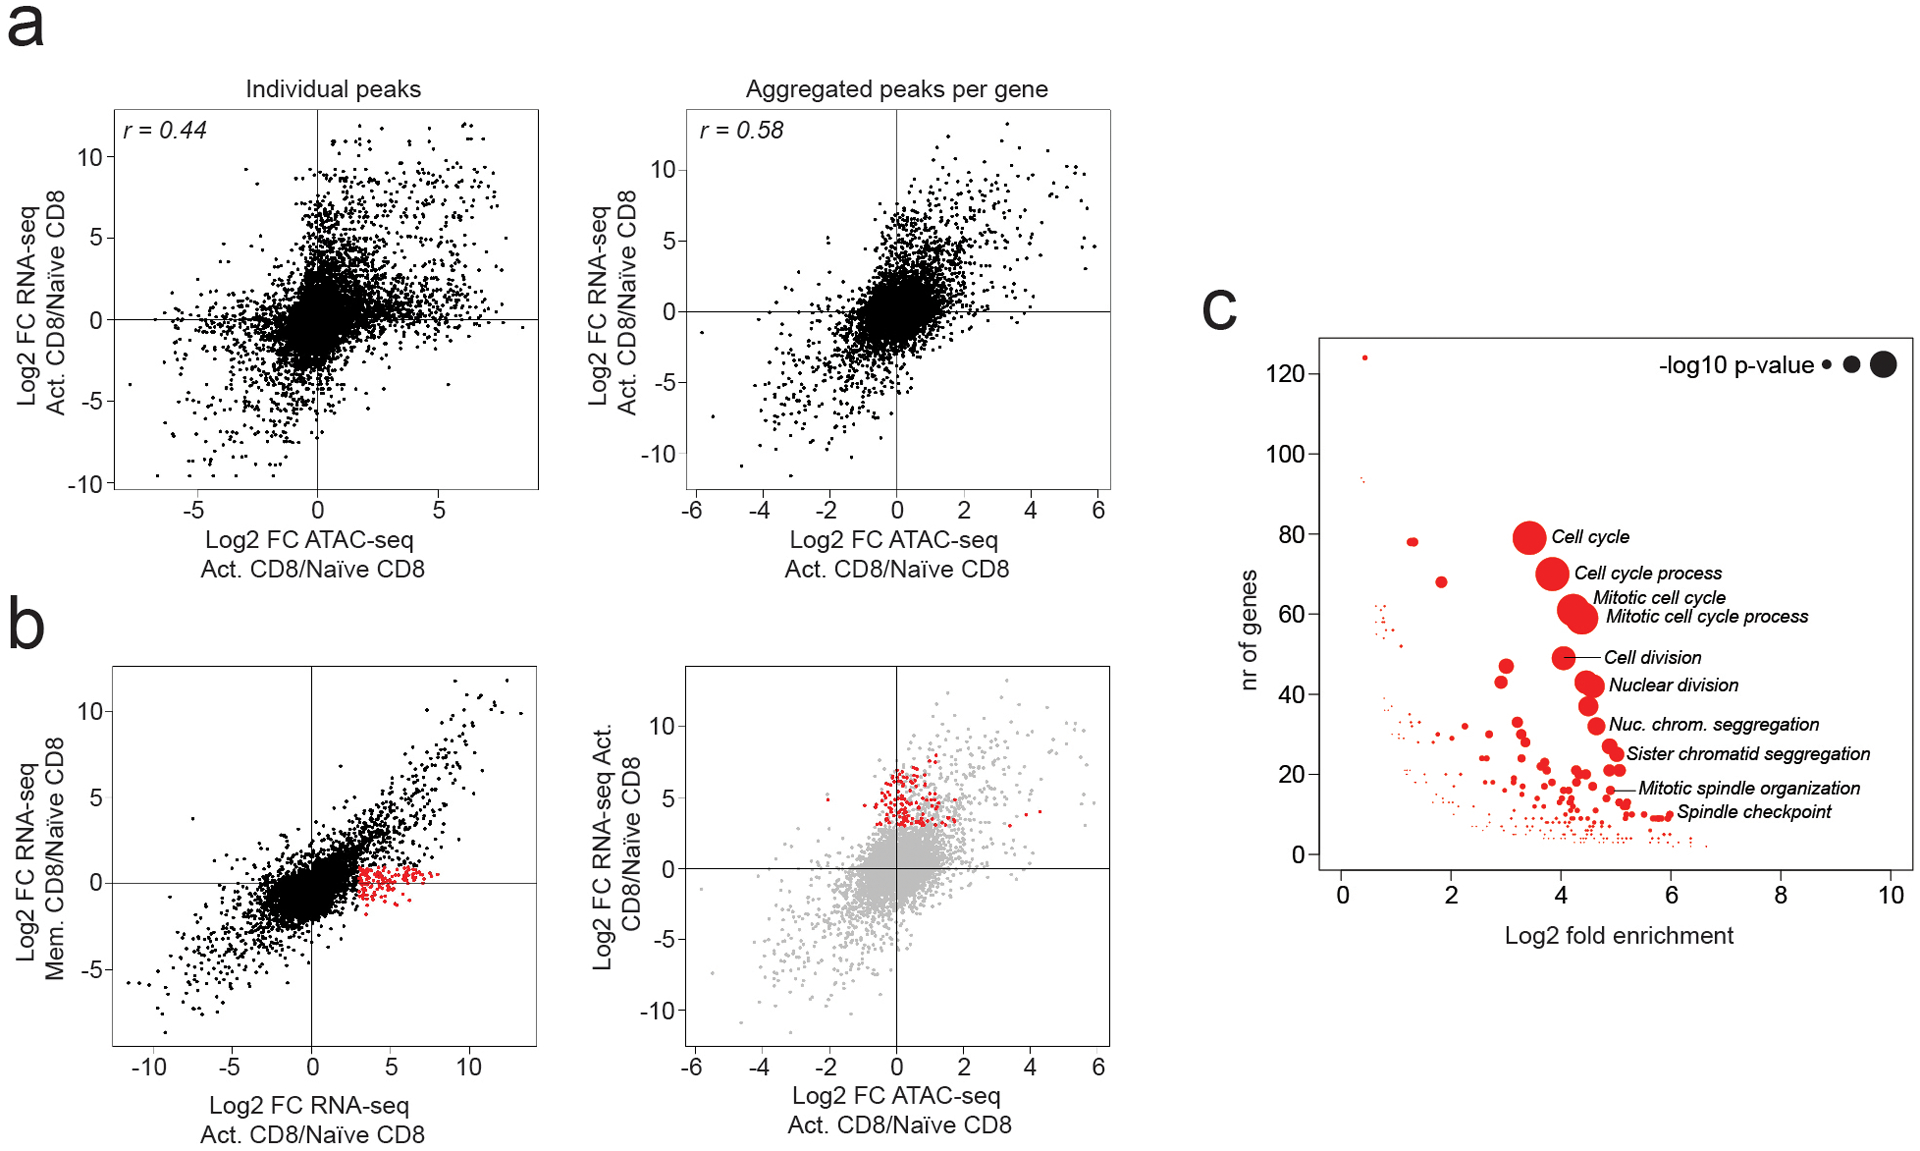
Extended Data Fig. 2. Association between gene expression and chromatin accessibility changes.

a: Correlation between changes in chromatin accessibility and gene expression in activated vs naïve CD8 T cells. Showing individual ATAC-seq peaks linked to the nearest gene (left) or the sum of counts across all ATAC-seq peaks linked to the same gene (right).
b: Fold change in gene expression in activated vs naïve CD8 T cells (x-axis) plotted against the fold change in gene expression in memory vs naïve CD8 T cells (y-axis). A subset of genes whose expression is transiently induced upon T cell activation is highlighted in red (left). Aggregated chromatin accessibility and gene expression changes for this gene set (right).
c: Gene ontology (GO) term enrichment analysis on genes highlighted in panel B
