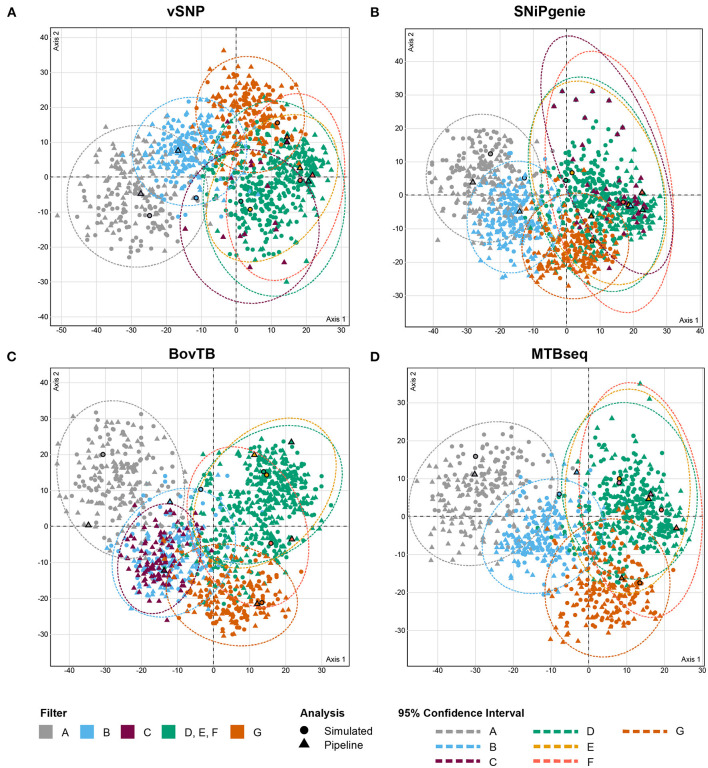
Figure 5.
MCA analysis of the RF distances (first two dimensions) between maximum likelihood (ML) trees obtained from core SNP multi-FASTA alignments produced by (A) vSNP, (B) SNiPgenie, (C) BovTB, and (D) MTBseq. Shapes without outlines correspond to bootstrap replicates whereas bold shapes correspond to the best ML trees output by RAxML. Color shading corresponds to the hard filtering approach used.

