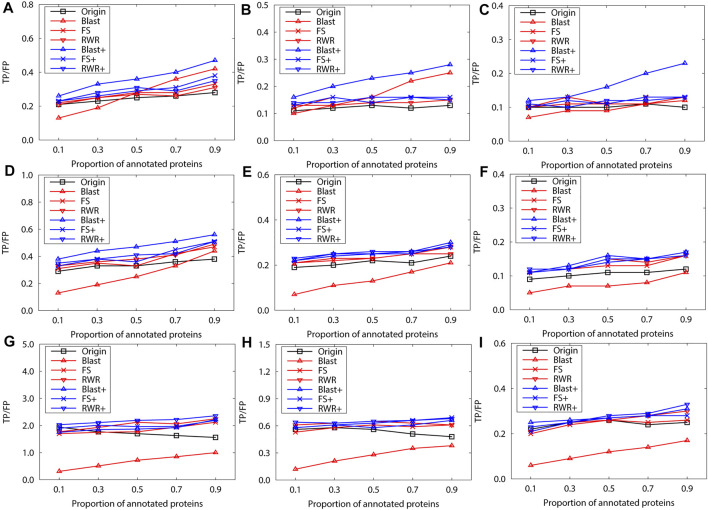
FIGURE 3.
The performance evaluation over the sparsely-labeled networks (Dataset A: M.musculus). Here, the sub figures in the horizontal and vertical directions represent the experimental results for the PPI networks of different function types and rank predicted functions, respectively. Horizontally, the top three subplots represent ones on the PPI networks of molecular function, the middle for ones of biological process, and the bottom for ones of cellular component (A), (D) and (G) first rank predicted function, (B), (E) and (H) second rank predicted function, (C), (F) and (I) third rank predicted function.

