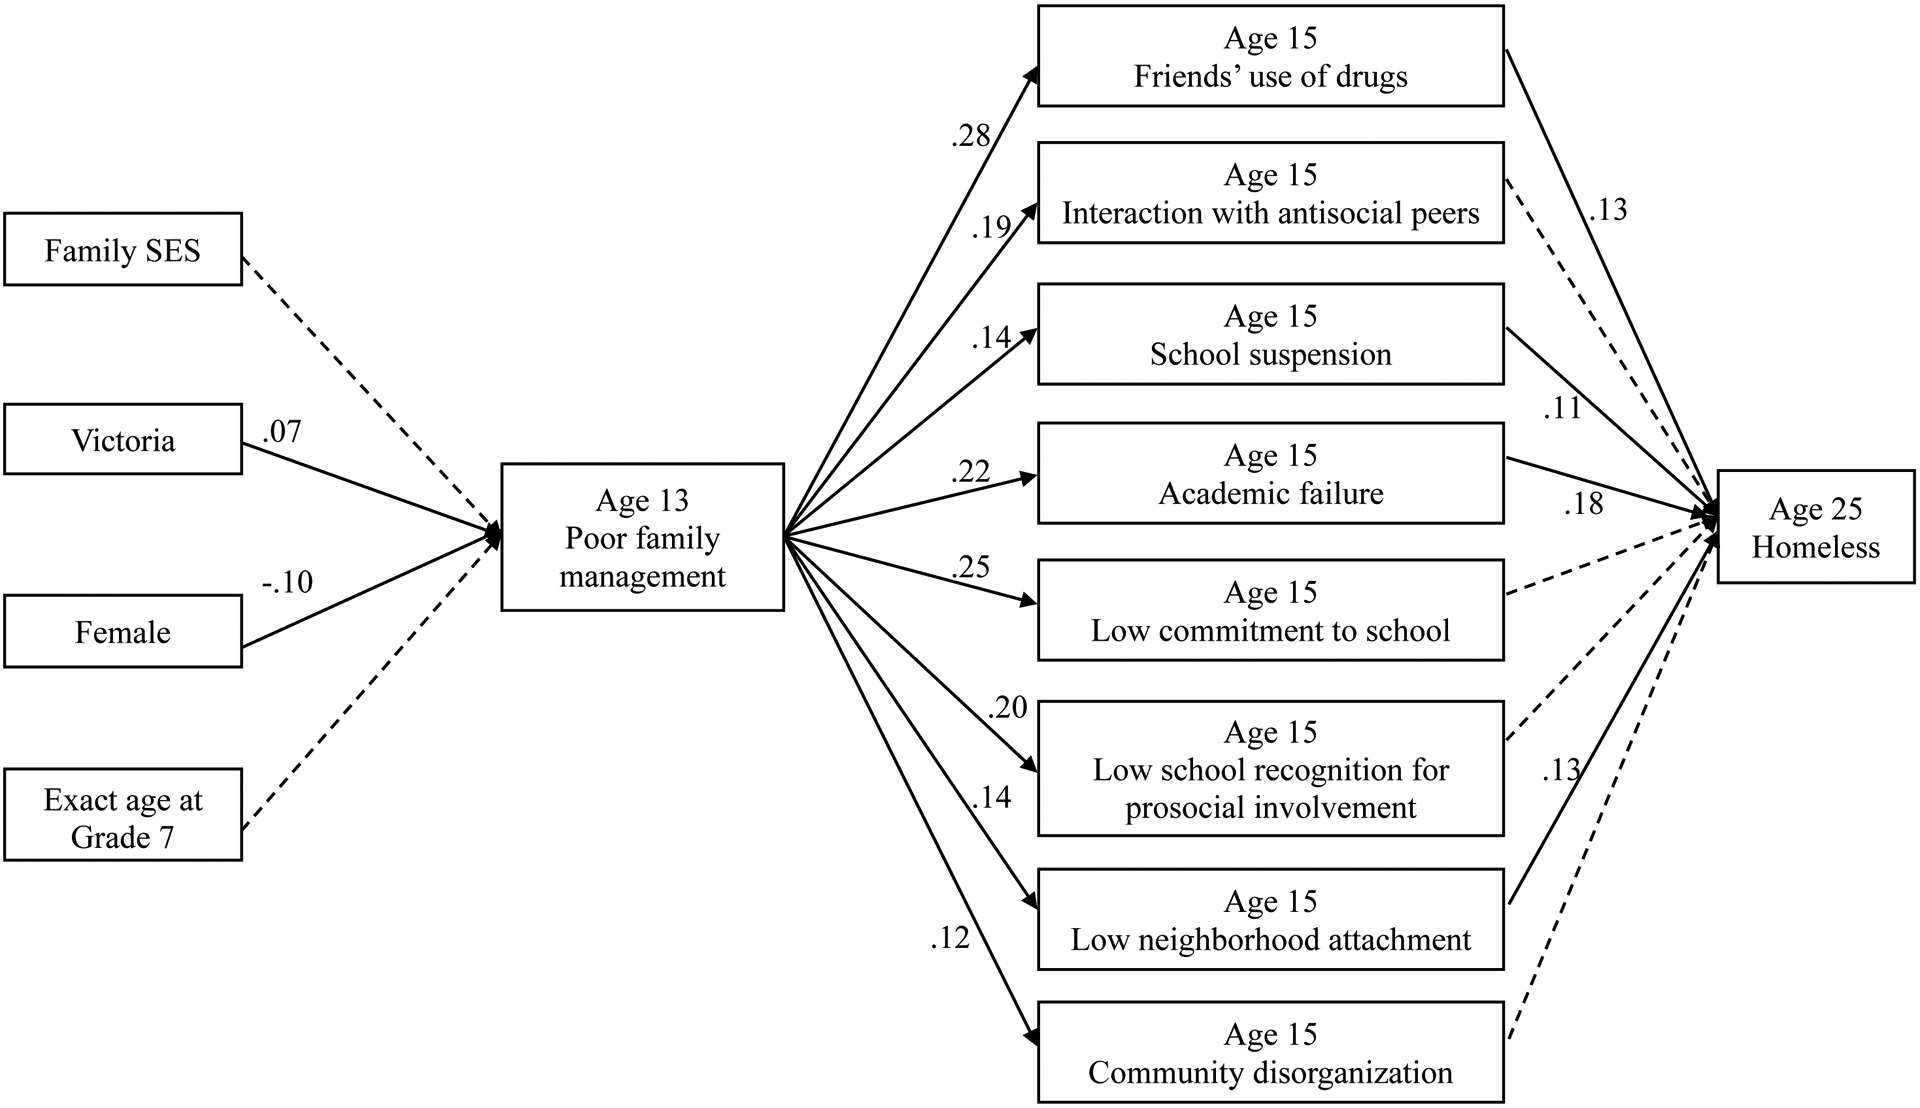
Figure 3.

Results from the path model: family, peer-group, school, and community antecedents of young adult homelessness.
Note. Model fit statistics: χ2(22, N = 1878) = 6329.76, p < .0001, CFI = 1.00, TLI = 1.00, RMSEA estimate = 0.00. Dashes indicate non-significant paths. Solid lines indicate paths significant at p < .05. For ease of viewing, paths from demographic variables to each of the Grade 9 antecedents are not included in the Figure, however, they were included in the model.
