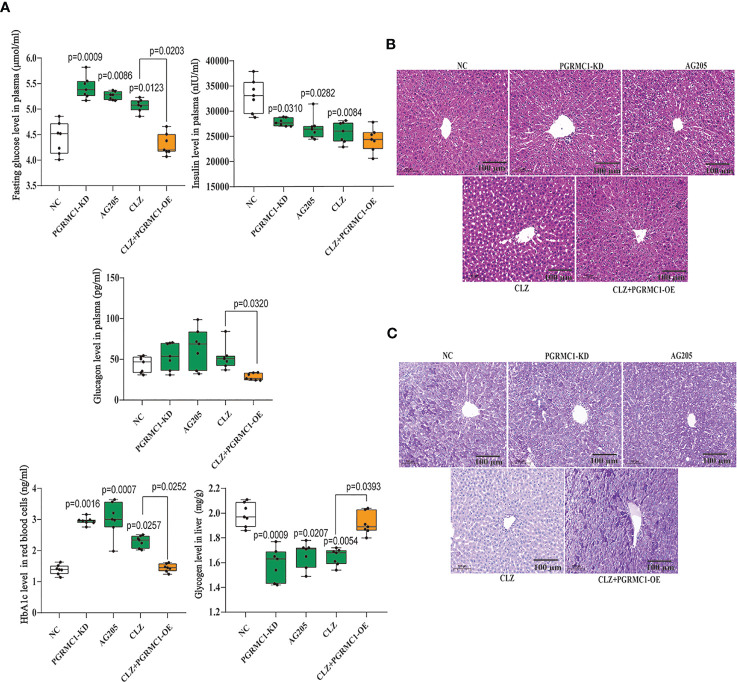
Figure 3.
Chronic effects of CLZ on glucose metabolism. (A) Biochemical parameters including fasting plasma glucose (H = 28.96, p < 0.0001), HbA1c (H = 28.21, p < 0.0001), insulin (H = 21.25, p = 0.0003), hepatic glycogen content (H = 25.56, p < 0.0001) and glucagon levels (H = 16.08, p = 0.0029). (B) H&E staining. (C) Representative images of PAS staining of liver sections, showing that the decreased glycogen in CLZ-treated rat was prevented by PGRMC1-OE. Red: glycogen; purple: nuclei of liver cells.

