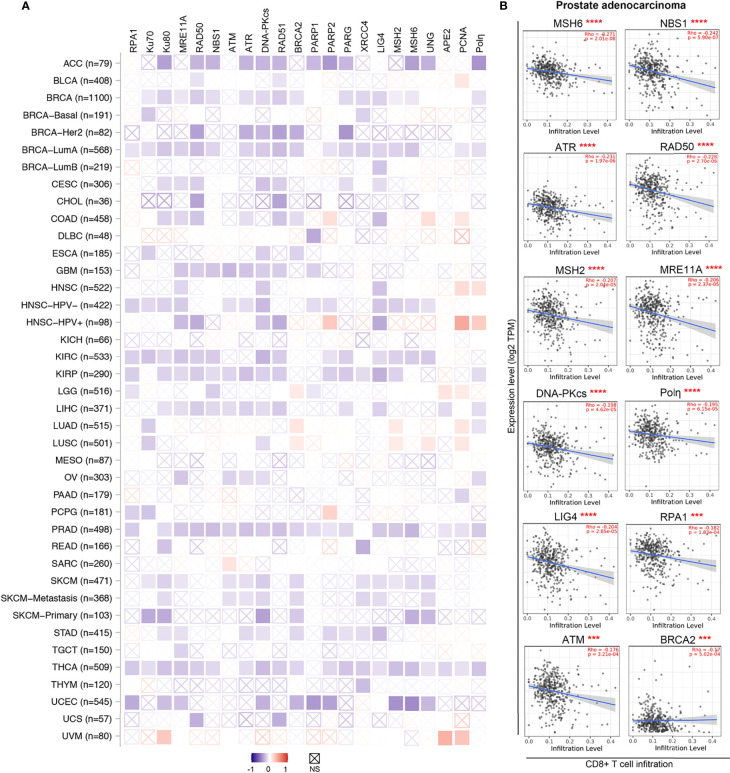
Figure 3.
DDR factors negatively associate with CD8+ T cells infiltration levels in diverse cancer types. (A) A heatmap based on the CIBRSORT method shows the purity-adjusted Spearman’s rho of DDR factors with CD8+ T cells across various cancer types. The boxes with indicate non-significant p values (p>0.05). The figures was made using the TIMER2.0 web server based on CIBRSORT analysis (http://timer.cistrome.org/). (B) Detailed correlation between DDR factors and CD8+ T cells in prostate adenocarcinoma (PRAD) from panel (A) The purity-adjusted Spearman’s rho and p value are labeled in red. ***p < 0.001; ****p < 0.00001.

