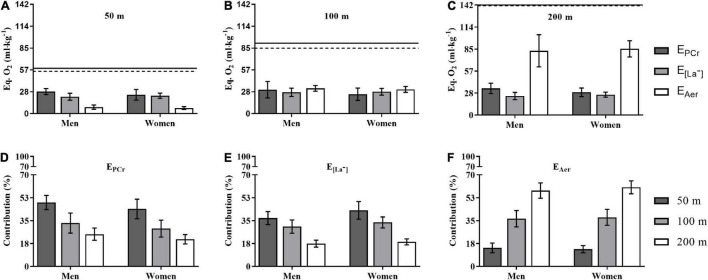
FIGURE 3.
The energetic demand (A–C) contribution (D–F) to the performance in 50, 100, and 200 m for men and women. Obs.: Horizontal continuous and traced lines at the top of Panels (A–C) refer to ETotal for men and women, respectively. The acronyms EPCr, E[La−], and EAer represent the phosphagenic, glycolytic, and aerobic components of ETotal. See text for statistical analysis.

