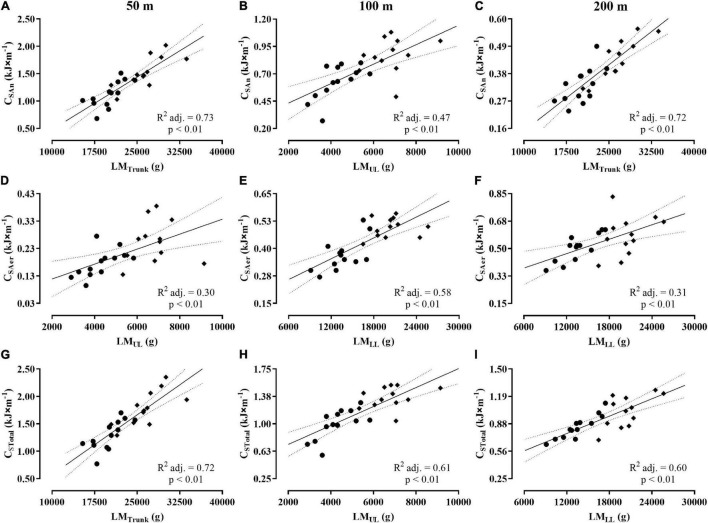
FIGURE 5.
Dispersion plots between body composition variables and values of CAn, CAer, and CTotal for the 50 m (A,D,G), 100 m (B,E,H), and 200 m (C,F,I). Obs.: The symbols (♦) and (●) represent the dispersion for men and women, respectively. The acronyms CAn, CAer, and CTotal represent the anaerobic, aerobic, and total costs.

