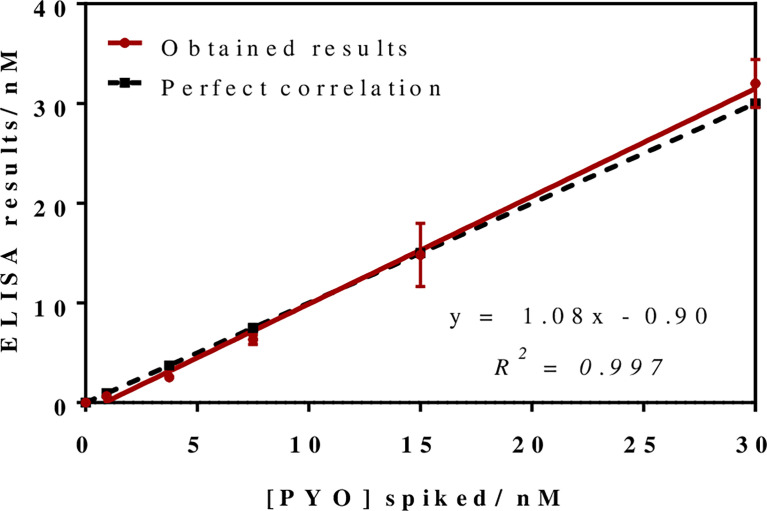
Figure 3.
Results from the accuracy study. The graph shows the linear regression analysis obtained representing the different pyocyanin (PYO) concentrations spiked in Mueller–Hinton (MH) broth against the concentration measured with the PYO mAb122/PC1-BSA ELISA. Assays were run in MH culture media diluted 1/20 using PBST. Each calibration point was measured in triplicates on the same ELISA plate and the results show the average and standard deviation of analysis made on three different days.

