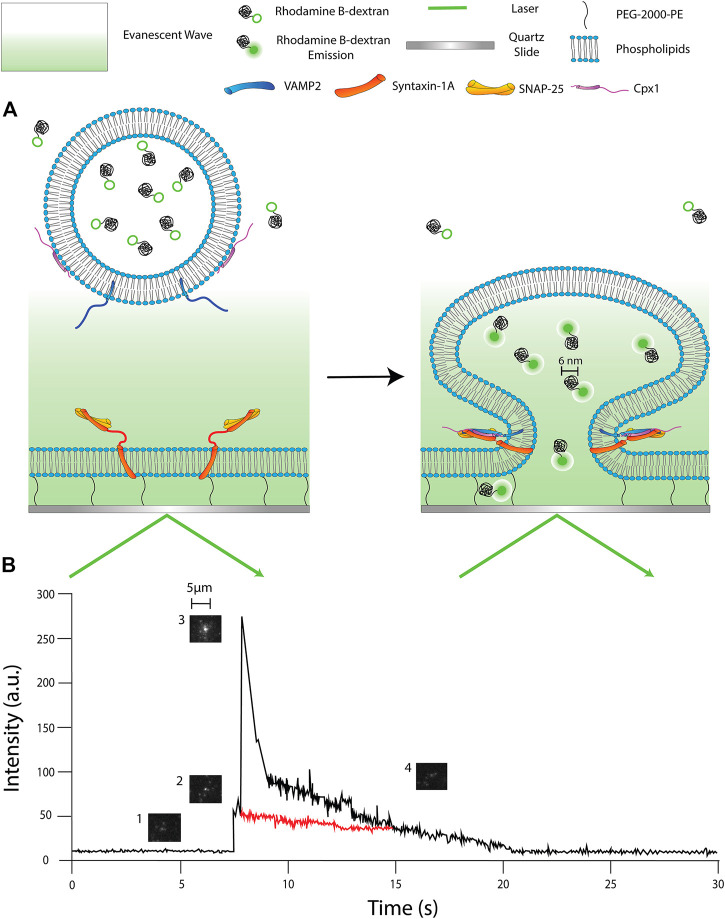
FIGURE 2.
Schematics of single vesicle-to-supported bilayer fusion assay. (A) (Left panel) the reconstituted vesicle is filled with Rhodamine B dextran (RB-dextran) and has not yet entered the region of the evanescent wave. (Right panel) the vesicle has engaged with the supported bilayer and formed a pore larger than ∼6 nm; the RB dextran is fluorescent and diffuses into the PEG-pillared aqueous space. (B) A fluorescence time-trace of a single fusion event. 1) The vesicle approaches the membrane but has not entered the evanescent wave. 2) The vesicle docks, resulting in an increase in fluorescent intensity. 3) The fusion pore expands to a larger diameter, causing a large spike in fluorescence. 2D diffusion of dye is being observed. 4) The pore constricts, but the internal content slowly diffuses out of the vesicle. (Red trace) Exemplary time trace of an event without achieving a large fusion pore status. The trace does not show an early fluorescence spike nor 2D diffusion.

