
FIGURE 6.
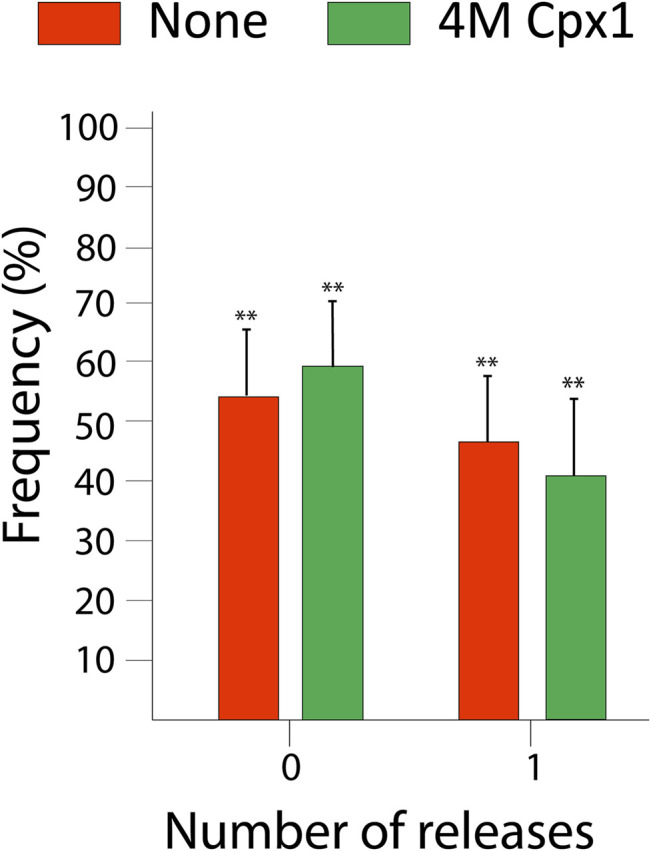
Bar graph displaying the distribution of the percent of vesicles showing large fusion pore forming events among docked vesicles without cpx1 (red) and for the non-SNARE binding cpx1 mutant 4M (green). The data is shown as means ± SD. **p ˂ 0.01 by Students’ t-test; n = 3 independent experiments.