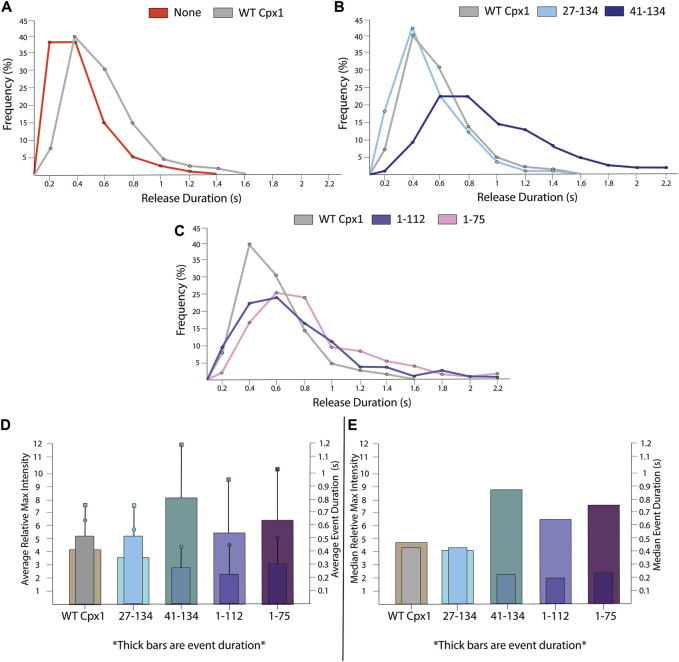
FIGURE 9.
For truncation mutants of cpx1, the duration of the large fusion pore is longer than that of WT cpx1. (A) Distribution of release durations without cpx1 and with WT cpx1. (B) Distribution of release durations of N-terminal truncation mutants of cpx1. (C) Distribution of release durations of C-terminal truncation mutants of cpx1. (D) The reciprocal relationship between average relative max intensity (left y-axis) and average event duration (right y-axis). For each graph, the thick bars represent event duration while max intensity is represented by thin bars. Boxes represent SD of event duration. Circles represent SD of relative max intensity. (E) The reciprocal relationship between median relative max intensity (left y-axis) and median event duration (right y-axis). For each graph, the thick bars represent event duration while max intensity is represented by thin bars.

