FIGURE 5.

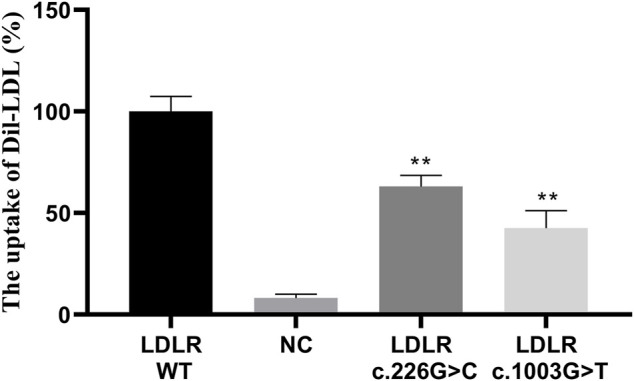
The LDL uptake in different LDLR groups. ** indicates statistical difference between mutant group and WT group (p < 0.01).

The LDL uptake in different LDLR groups. ** indicates statistical difference between mutant group and WT group (p < 0.01).