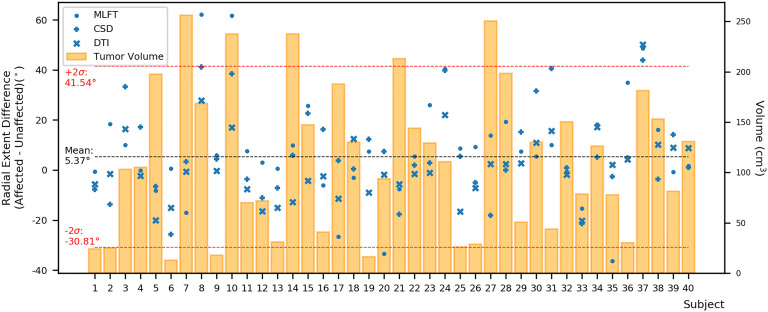
Figure 6.
Differences between the radial extent of tumor-affected and unaffected hemispheres. This figure shows the radial extent differences in relation to combined tumor and FLAIR-hyperintense zone volumes (orange) using the mean (black dashed line) with +/- 2 standard deviation (SD, provided as σ; red dashed lines) to identify potential outliers. Circles represent data points for the corticospinal tract (CST) as derived from multi-level fiber tracking (MLFT), while + represents data points derived from constrained spherical deconvolution (CSD)-based tractography and x represents data points stemming from diffusion tensor imaging (DTI)-based tractography. The outliers with positive radial extent difference are of most interest as they show unexpected behavior with higher radial extent in the tumor-affected hemisphere.

