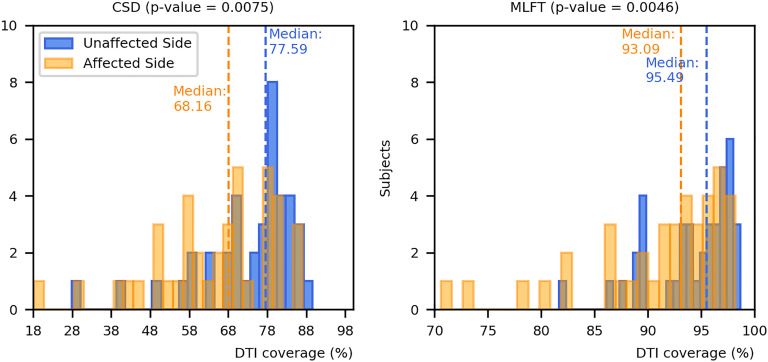
Figure 8.
Comparison of coverage for corticospinal tract (CST) branches. This figure shows the coverage (with median values as vertical dashed lines) of the CST reconstructions derived from diffusion tensor imaging (DTI)-based tractography by constrained spherical deconvolution (CSD)-based tractography or multi-level fiber tracking (MLFT). Columns for the tumor-affected hemispheres are displayed in orange, columns for the unaffected hemispheres are depicted in blue. The affected hemispheres show lower coverage compared to the tumor-unaffected hemispheres. The p-values are derived from comparisons between hemispheres per tractography algorithm (Wilcoxon signed-rank paired tests with significance level α=0.05).

