FIGURE 2.
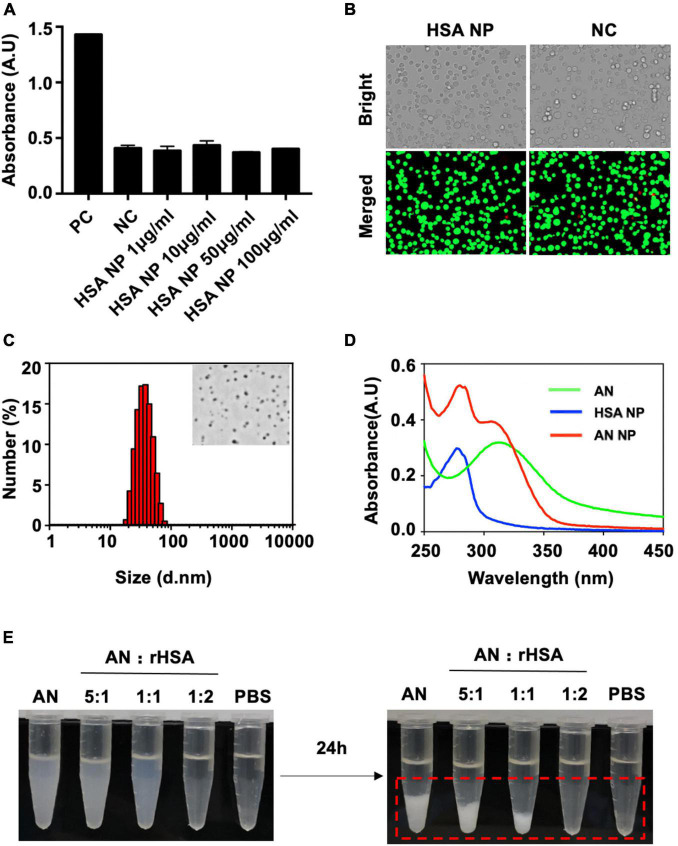
Cytotoxicity, characterization, and dispersibility analysis of produced nanoparticles. (A) RAW264.7 macrophages incubated overnight were separated into the following groups: Positive control (PC), negative control (NC), or experimental groups receiving different concentrations of HSA NP for 3 h. LDH was then released by cells, detected, and measured. (B) Cellular viability staining (i.e., live/dead assessment of cells) of RAW264.7 macrophages in either the NC (0 μg/mL, 4 h) or HSA NP (50 μg/mL, 4 h) groups. Red indicates dead cells and green indicates live cells. (C) Hydrodynamic size of AN-NP as determined by DLS. The inset figure is a representative TEM image of AN-NP. (D) UV-vis absorbance spectra of AN, HSA NP, and AN NP. (E) Dispersibility of mixture of rHSA and AN (250 μg/mL) with an indicated ratio in PBS buffer at room temperature for 24 h. Red dotted box indicates visible coagulation.

