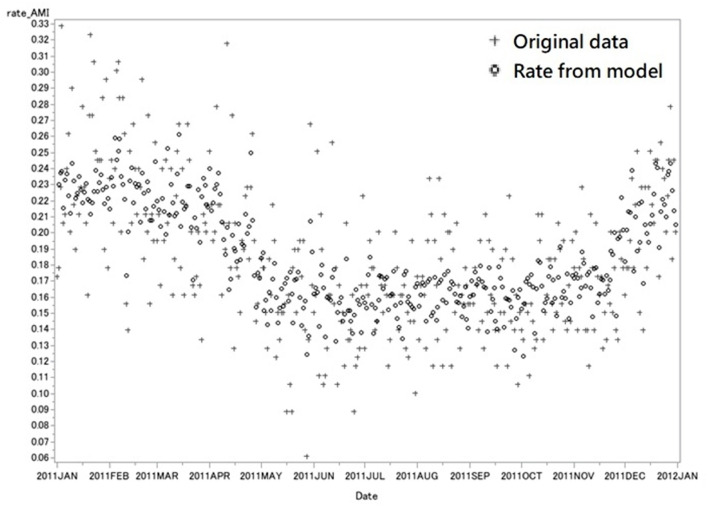
Figure 5.
External Validation with data in 2011. This figure showed the original rate of daily AMI admission (cross) and the predicted rate from model (circle) in 2011. Each marker represents the rate of AMI in 1 day. The rate of AMI is the number of AMI admission per 100,000 population in one single day. The AIC of internal validation was −1400.293, and the explained deviance was 47.3%.

