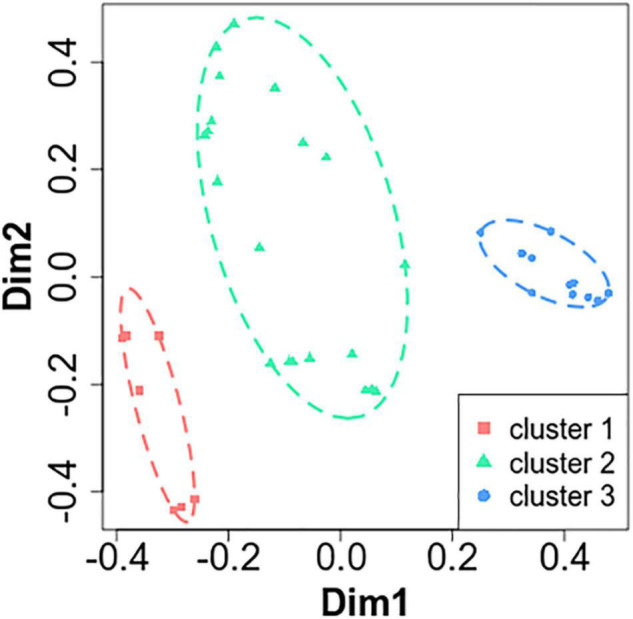
FIGURE 1.

Principal coordinate analysis (PCoA) on microbiota revealed three clusters in stable chronic obstructive pulmonary disease patients. Unsupervised PcoA was plotted based on the Bray–Curtis dissimilarity matrix. The two most important eigenvectors were used for visualization (19 and 13% of variance explained, respectively). Clusters of patients were identified based on the k-means algorithm, and a spanning ellipsoid was added.
