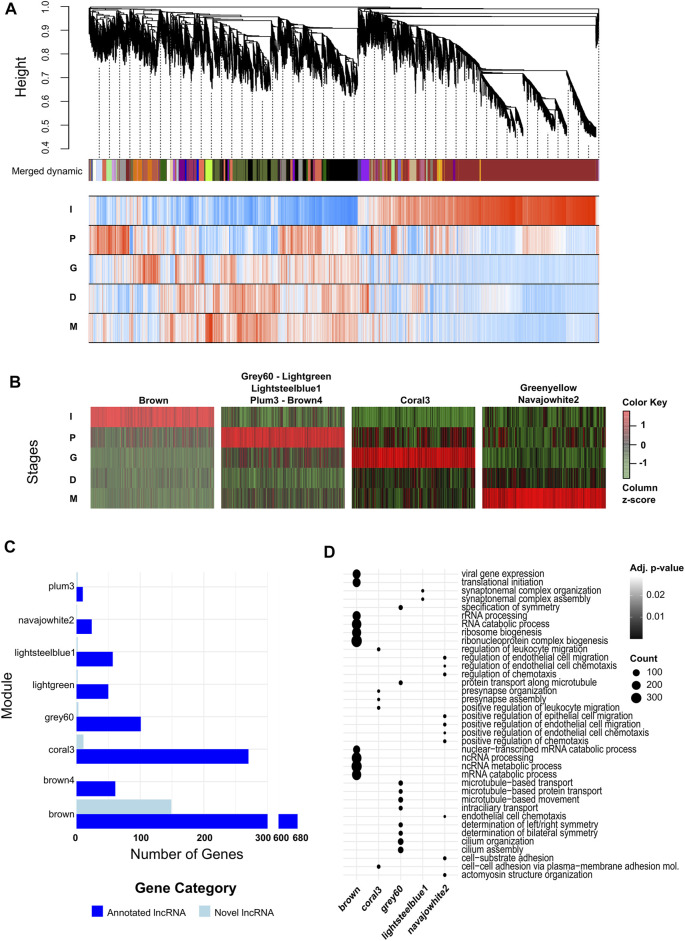
FIGURE 4.
lncRNAs expressed during different stages of neural differentiation from iPSCs are associated with protein coding genes implicated in neural development biological processes. (A) WGCNA dendrogram and module affiliation graph of the transcriptome and association of gene expressions with biological conditions during neural differentiation. Each branch of the dendrogram represents a single gene expressed during neural differentiation. The colored bar under the dendrogram indicate the module the gene belongs in, with each color indicating a single module. The heatmap underneath the colored bar shows stage-module correlation levels, with red cells indicating positive correlation, blue cells indicating negative correlation, and darker colors indicating stronger correlation levels. (B) Scaled heatmaps of genes in modules showing strong association with single maturation stage (Pearson correlation coefficient ≥0.7). (C) Bar graphs indicating lncRNA module membership in clusters of interest categorized into annotated and novel lncRNAs. (D) Dot plot of GO terms enriched in gene clusters of interest. Up to 10 sets are selected in order of Benjamini-Hochberg adjusted p-values in each module. Size of the dots indicate the number of genes in the module associated with the GO term.

