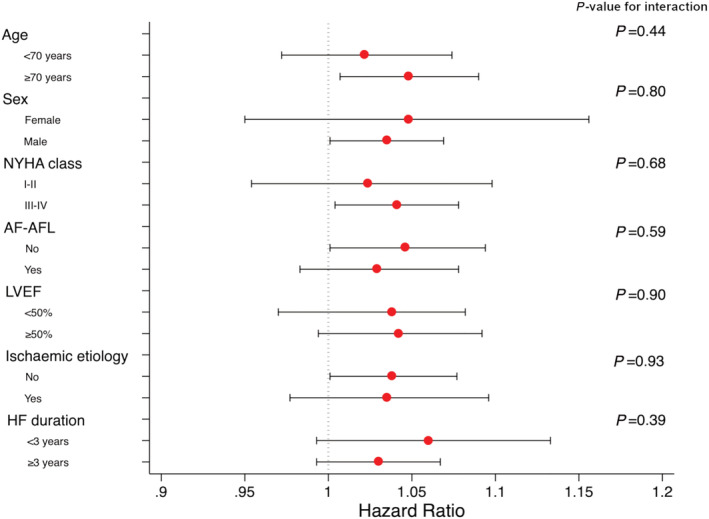
Figure 3.

Forest plots for B‐lines sum for the composite endpoint of all‐cause death or HF hospitalization at 30 days according to several subgroups. Circles represent hazard ratio values, while the horizontal lines through the circles illustrate the length of the confidence interval.
