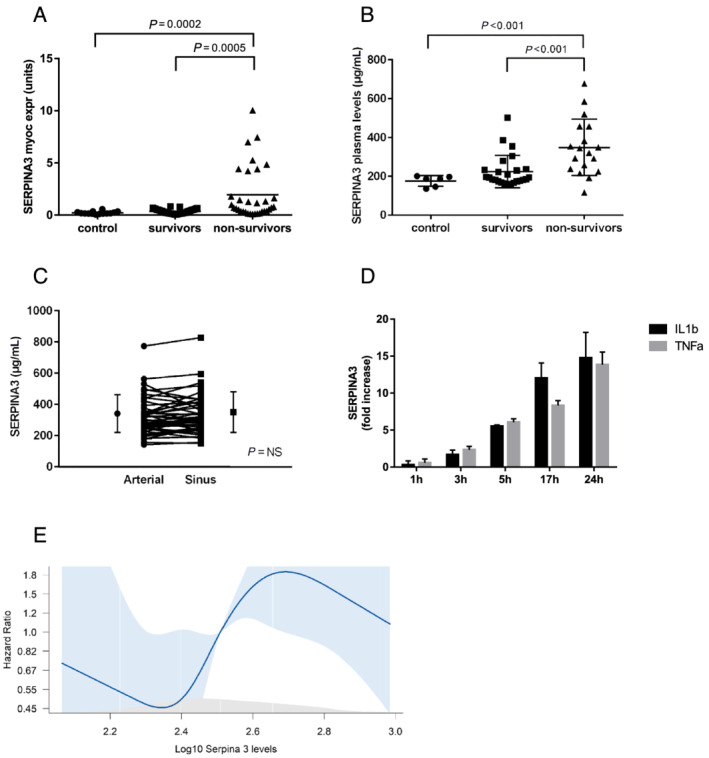
Figure 1.

SERPINA3 expression levels. Panel (A) shows SERPINA3 myocardial expression in surviving and non‐surviving heart failure patients compared with control patients. Panel (B) shows SERPINA3 plasma levels in surviving and non‐surviving heart failure patients compared with control patients. Panel (C) shows transmyocardial gradient of SERPINA3 as a difference between coronary sinus and arterial levels. Panel (D) shows fold increase in SERPINA3 secretion by human coronary artery endothelial cells after IL‐1β or TNF‐α stimulation compared with unstimulated cells (data represent four experiments). Panel (E) shows spline curve analysis to determine the optimal SERPINA3 cut‐off value for all‐cause mortality.
