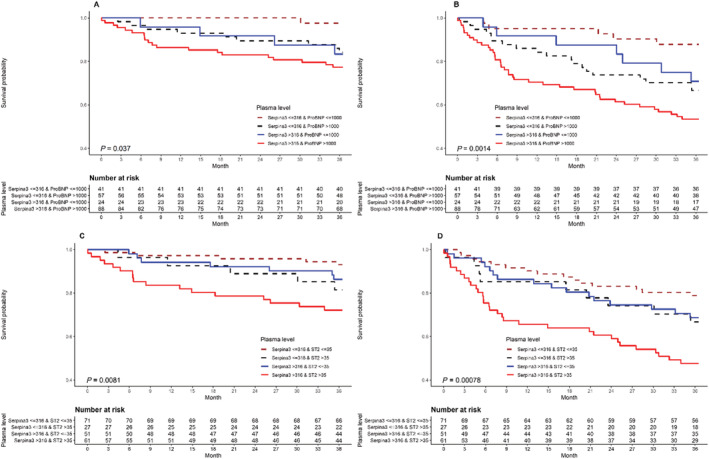
Figure 3.

Relationship between SERPINA3 levels and clinical outcome in combination with NT‐proBNP or ST2. All‐cause mortality is shown in panels (A) (SERPINA3 and NT‐proBNP) and (C) (SERPINA3 and ST2) while the composite endpoint of survival and first unplanned cardiac readmission is shown in panels (B) (SERPINA3 and NT‐proBNP) and (D) (SERPINA3 and ST2).
