
Figure 2.
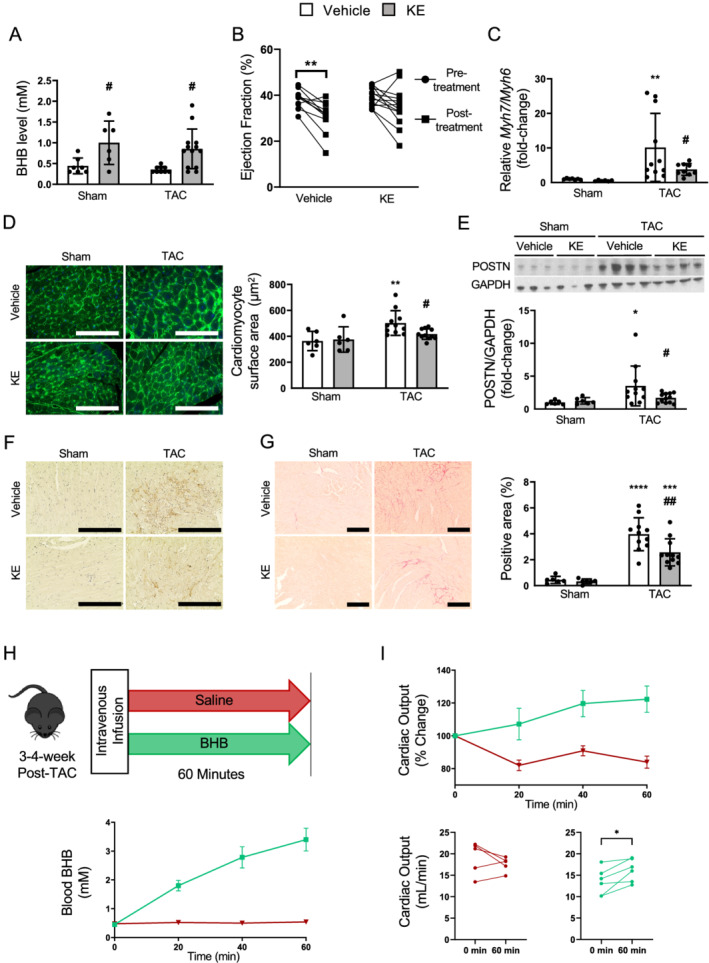
Chronic ketone ester treatment of mice with heart failure blunted a further decline in cardiac function, ameliorated cardiomyocyte hypertrophy, and reduced activation of cardiac fibroblasts. (A) Circulating BHB levels at random fed states (n = 7, 6, 11, 13). (B) Change in % ejection fraction during the treatment period in TAC groups (n = 11, 13). (C) The ratio of transcript levels of Myh7 and Myh6 in the heart (n = 7, 6, 11, 13). (D) Representative images and quantification of cardiomyocyte surface area using wheat‐germ‐agglutinin staining conjugated with Alexa Fluor 488 (n = 6, 6, 11, 12; 170–298 cells/mouse). The scale bars indicate 100 μm. (E) Representative immunoblots and semi‐quantification of POSTN (periostin)/GAPDH in the hearts (n = 7, 6, 11, 13). (F) Representative images of immunostaining with anti‐POSTN antibody, where the positive is indicated by the brown stain. The scale bars indicate 100 μm. (G) Representative images and quantification of formalin‐fixed LV heart sections stained with picrosirius red (n = 6, 6, 11, 12). The scale bars indicate 200 μm. (H) Schematic of acute intravenous infusions. Blood ketone levels of mice 3–4 weeks post‐TAC undergoing either intravenous BHB or saline infusions for 60 min, and (I) the corresponding changes in cardiac output (n = 5 saline, 6 BHB). Dots represent individual values. Results are expressed as the mean ± standard deviation. * indicates the comparison with its sham group in (A) and (C–G). # indicates the comparison between vehicle and ketone in either sham or TAC group. *, # P < 0.05, **, ## P < 0.01. P‐values were derived by repeated two‐way ANOVA in (B) and two‐way ANOVA followed by Sidak's multiple comparisons in (A) and (C–G), and by paired t‐test in (I). BHB, β‐hydroxybutyrate; KE, ketone ester; TAC, transverse aortic constriction.