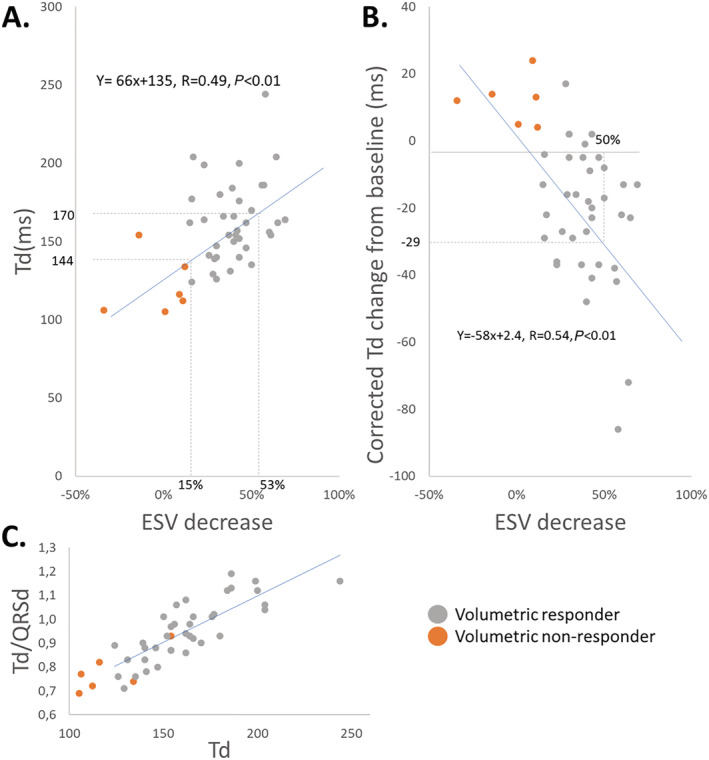
Figure 5.

Crude estimates of the relationship between the baseline Td and reverse remodelling and the relationship between the corrected change in Td and reverse remodelling. (A) Scatterplot is showing the relationship between Td and ESV decrease. Stippled lines mark corresponding baseline Td values for a 15% and 53% ESV decrease—the line of equality in blue with the corresponding equation for the linear regression. (B) Scatterplot is showing the relationship between the corrected Td change from baseline and ESV decrease. The corrected change means that 15 ms is added to the baseline Td to compensate for the capture latency with pacing. The stippled lines show the corresponding value of Td change to a 50% decrease in ESV. Line of equality in blue with the corresponding equation for the linear regression. (C) Scatterplot is showing the relationship between the ratio Td/QRSd and Td. The relationship shows that a longer baseline Td is also longer relative to the baseline QRS duration. ESV, end‐systolic volume; Td, time‐to‐peak dP/dt; QRSd, QRS duration.
