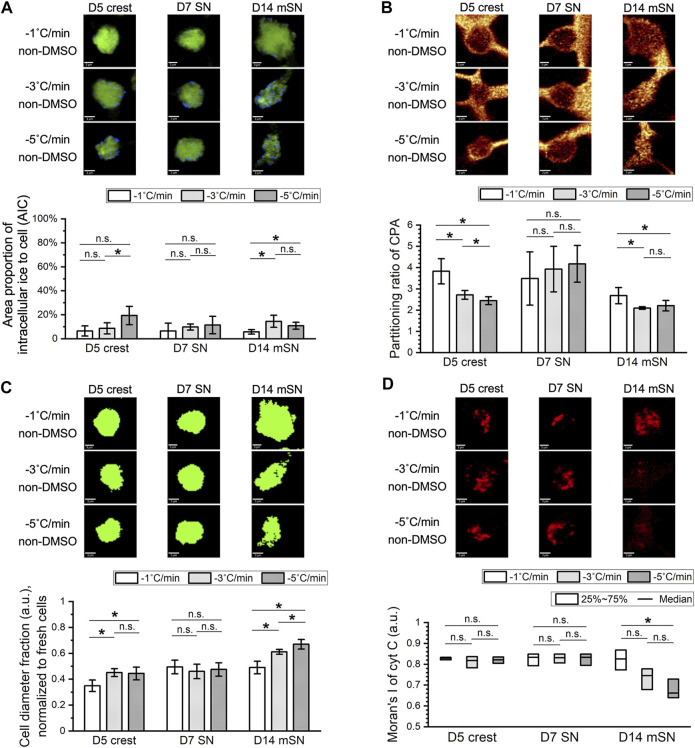
FIGURE 5.
Effects of cooling rate on freezing behaviors of D5 crest, D7 SN, and D14 mSN, as observed by low-temperature Raman spectroscopy, comparing different cooling rates between −1°C/min, −3°C/min, and −5°C/min, respectively. Data are represented as mean ± 95% confidence interval. n = 10. n.s.: p > 0.05; *p < 0.05 (see Supplementary Figure S2 for method illustration of each metric.) (A) Intracellular ice formation (blue) increased with the faster cooling rates in D5 crest and D14 mSN; no significant difference across cooling rates in D7 SN. (B) Membrane partitioning of non-DMSO CPA significantly decreased in D5 crest and D14 mSN with the faster cooling rates; no significant difference across cooling rates in D7 SN. (C) Loss of cell volume as a result of freezing intensified with the faster cooling rates for D5 crest and D14 mSN; no significant difference across cooling rates in D7 SN. (D) Significant cytochrome C (cyt C) release was observed for D14 mSN with the faster cooling rates but not for D5 crest or D7 SN at any of the cooling rates. Kruskal–Wallis ANOVA performed for non-normal distribution of cyt C Moran’s I values.

