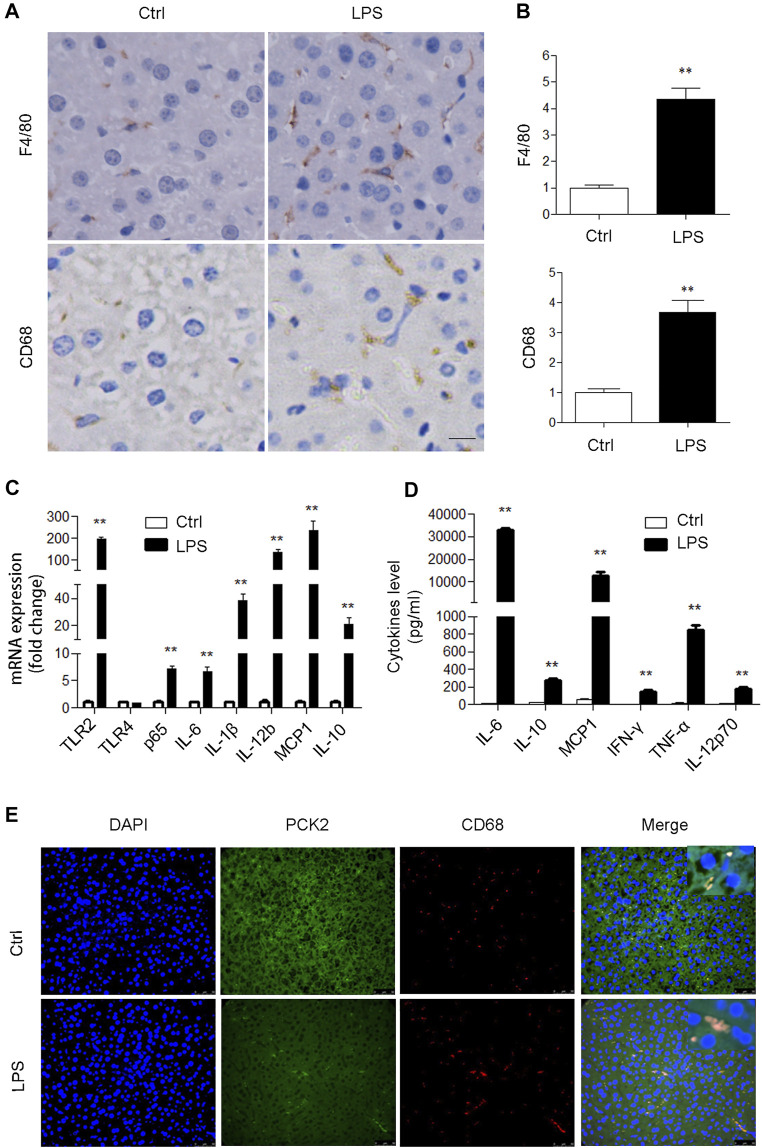
FIGURE 1.
PCK2 is increased in Kupffer cells after acute LPS administration in mice. (A) Immunohistochemical staining and quantification of F4/80 and CD68 in the liver (magnification, x400). (B) The expression levels of inflammatory cytokines were determined by real-time PCR. (C) The levels of inflammatory cytokines in plasma were determined by cytometric bead array (CBA). (D) Co-immunofluorescence staining of PCK2 and CD68. Values are mean ± SEM, n = 6. **p < 0.01 versus control group.

