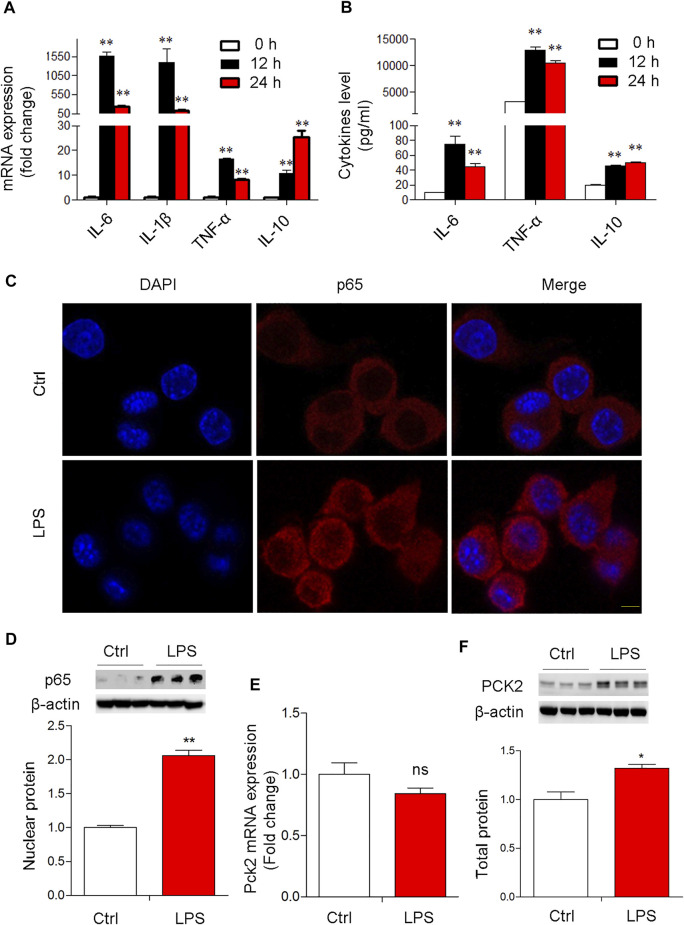
FIGURE 2.
LPS-induced NF-κB activation and PCK2 upregulation in vitro. (A) The mRNA expression of inflammatory cytokines in LPS-treated Kupffer cells (1 μg/ml) at different time-points. (B) The production of IL-6, TNF-α, and IL-10 was measured in the medium by CBA. (C) Representative fluorescence images of P65 nuclear translocation in Kupffer cells (scale bar: 20μm). (D) Nuclear p65 NF- κB was measured by Western blot. (E) The mRNA expression of PCK2 was determined by real-time PCR. (F), The total protein levels of PCK2 were determined by Western blot. Values are mean ± SEM. *p < 0.05, **p < 0.01.

