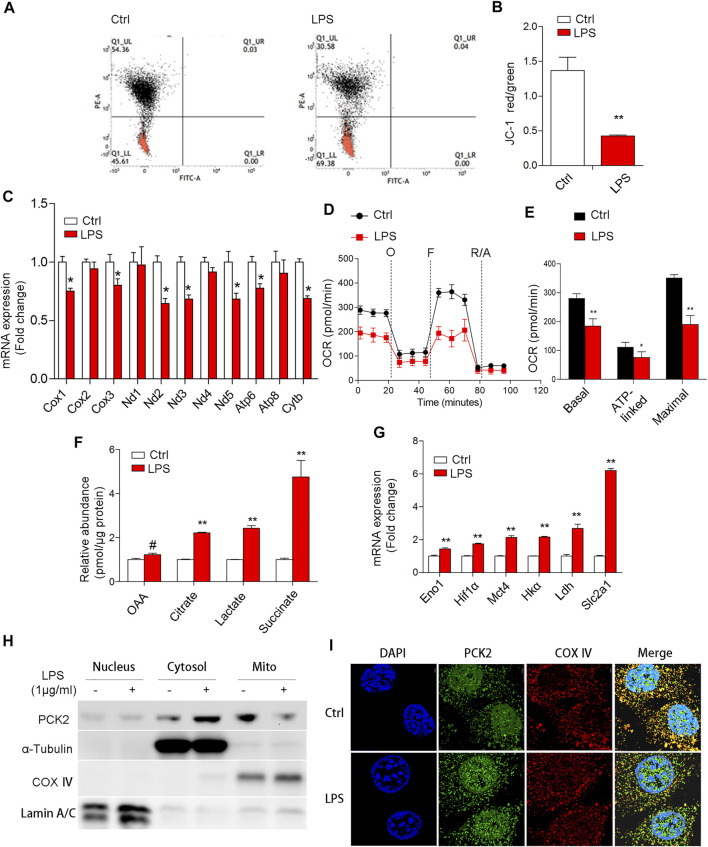
FIGURE 3.
LPS-induced mitochondrial dysfunction and PCK2 aggregates in the cytosol but not mitochondria. (A,B) Mitochondrial membrane potential was measured using the JC-1 probe by flow cytometry. (C) The mRNA expression of mitochondrial DNA-encoded genes was measured by real-time PCR. (D) Oxygen consumption (OCR) was measured with a Seahorse XF-24 analyzer. (E) The quantification of basal OCR, ATP-linked OCR, and maximal OCR. (F) The contents of mitochondrial or glycolytic intermediates including OAA, citrate, lactate, and succinate were measured by HPLC. (G) The mRNA expression of glycolytic enzymes was measured by real-time PCR. (H) The distribution of PCK2 was measured by Western blot using isolated protein from nuclear, cytosolic, and mitochondrial fractions. (I) Double immunofluorescence staining of PCK2 and COX Ⅳ by confocal laser microscopy. Values are mean ± SEM. *p < 0.05, **p < 0.01.

