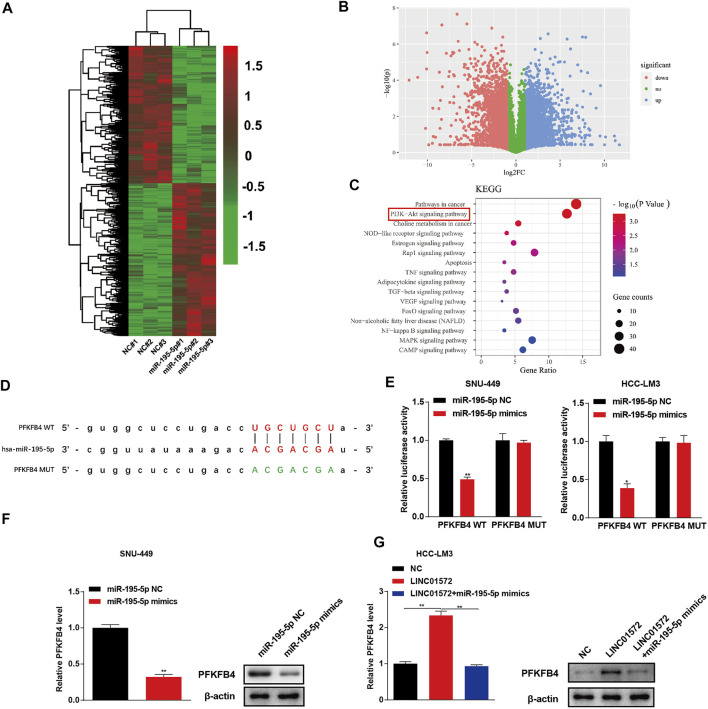
FIGURE 6.
miR-195-5p targets to PFKFB4 in HCC. (A) Heatmap of the differentially expressed genes after miR-195-5p overexpressed in SNU-449 cells (B) Volcano plot showing the significantly expressed genes. (C) KEGG analysis was used to screen the enriched pathways after miR-195-5p overexpressed. (D) Binding sites of miR-195-5p and PFKFB4 was predicted by using the ENCORI. (E) The target relationship of miR-195-5p and PFKFB4 were verified by dual-luciferase assay. (F) Influence of miR-195-5p mimics on the PFKFB4 level in SNU-449 cells. (G) Influence of miR-195-5p on LINC01572-induced upregulation of PFKFB4. All data are shown as mean ± standard deviation (n = 3). * p < 0.05, ** p < 0.01.

