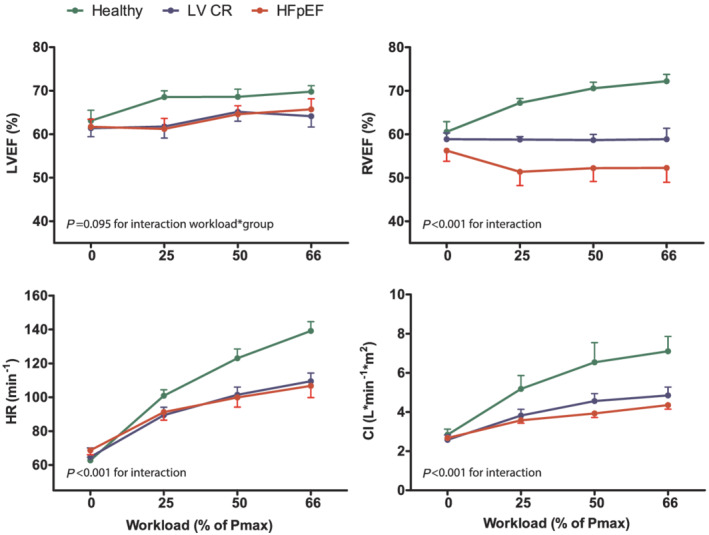
Figure 1.

Comparison of change in LV and RV ejection fraction (LVEF and RVEF, respectively), heart rate and cardiac index (CI) during incremental exercise in patients with HFpEF, patients with impaired relaxation (LVCR) and healthy controls. Workloads are presented as a percentage of maximum power output (Pmax) determined during previous exercise testing. P values are shown for the interaction between group and exercise intensity using linear mixed models. Data are presented as means and SEM at each time point.
