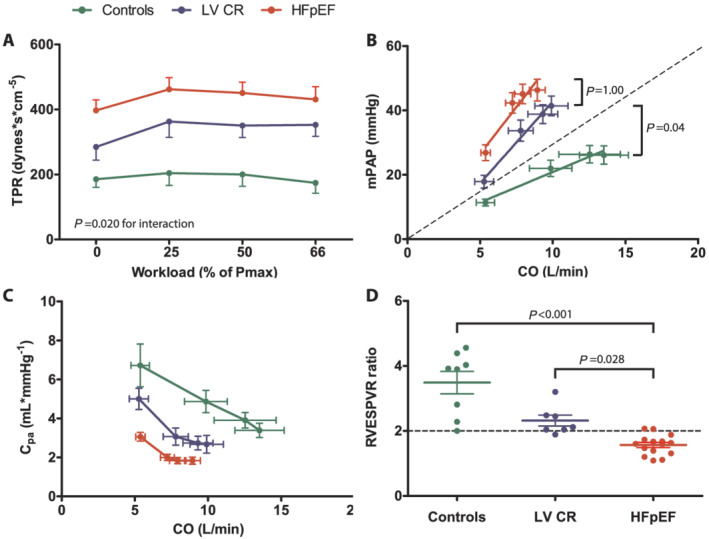
Figure 2.

Right ventricular afterload and contractile reserve in healthy controls, patients with impaired relaxation (LVCR) and patients with heart failure and preserved ejection fraction (HFpEF). (A) Evolution of TPR (total pulmonary vascular resistance) from rest to peak‐intensity exercise. Workloads are presented as a percentage of maximum power output (Pmax) determined at previous cardiopulmonary exercise testing. P value indicates interaction between group and exercise intensity using linear mixed models. (B) Linear mean pulmonary artery pressure (mPAP)‐cardiac output (CO) relationships based on averages of serial measurements of mPAP and CO during exercise. P values are given for between‐group differences in mPAP/CO slope using one‐way ANOVA. The dashed line indicates the upper limit of normal (slope = 3). (C) Evolution of pulmonary artery compliance (CPA) with increasing cardiac output at four‐stage exercise test. (D) Individual data points of the ratio of peak exercise RV end‐systolic pressure volume ratio (RVESPVR) to rest RVESPVR. The horizontal dashed line indicates the normal value (=2). P values denote the between‐group differences using one‐way ANOVA.
