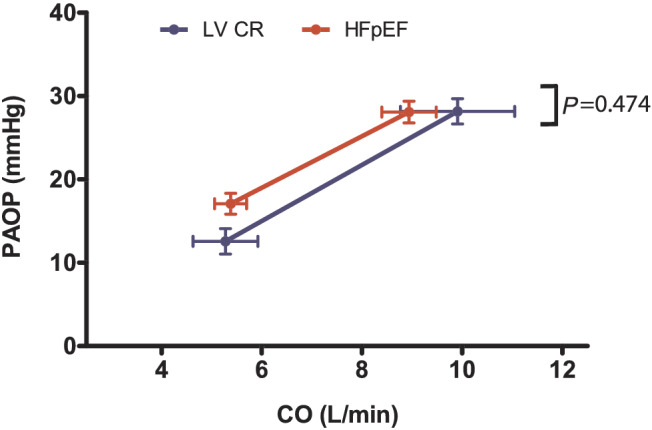
Figure 3.

Evolution of PAOP over CO from rest to peak exercise in HFpEF patients and patients with impaired relaxation (LVCR). Data are presented as mean ± SEM. No difference is seen between the PAOP/CO slopes of the two patient groups, using an independent‐samples t‐test (P = 0.474).
