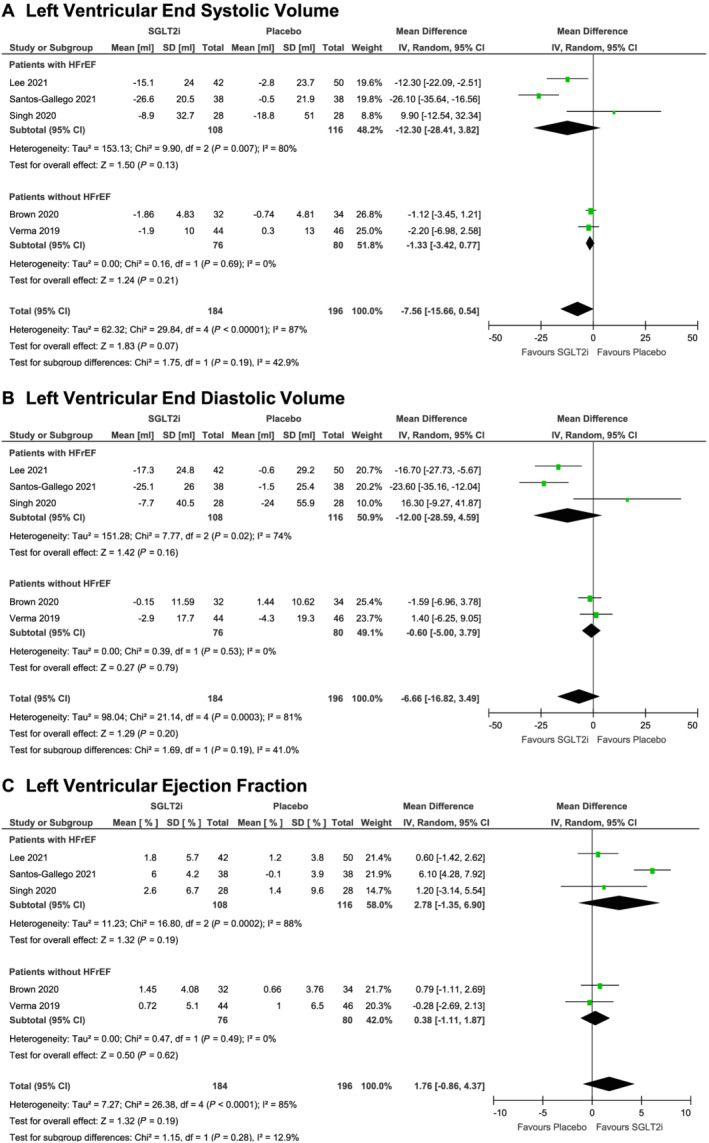
Figure 2.

Cardiac magnetic resonance imaging‐assessed changes in left ventricular end systolic volume (A), left ventricular end diastolic volume (B), and left ventricular ejection fraction (C) from baseline to study endpoint in randomized controlled trials of patients treated with sodium glucose transporter‐2 inhibitor therapy versus placebo.
