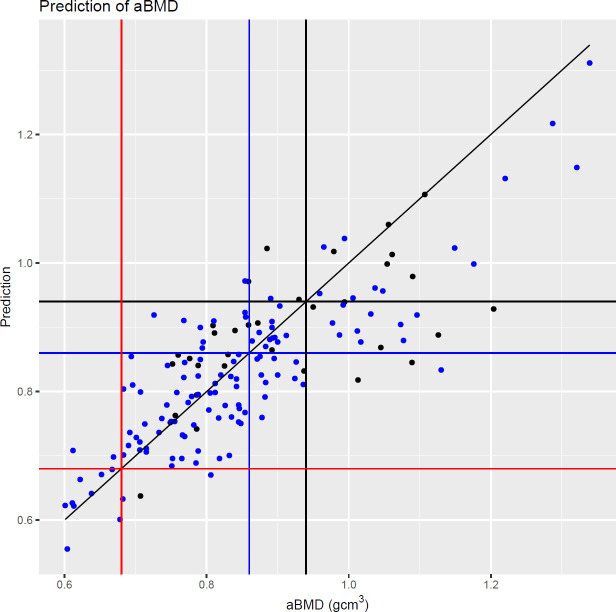
Figure 2.
Fitted values from the model presented in table 3 against areal bone mineral density (aBMD). Black points: male patients. Blue points: female patients. Black vertical and horizontal lines: male normal bone density threshold. Blue vertical and horizontal lines: female normal bone density threshold. Red vertical and horizontal lines: female low bone density threshold (osteoporosis). Diagonal black line: y = x.

