
Figure 4.
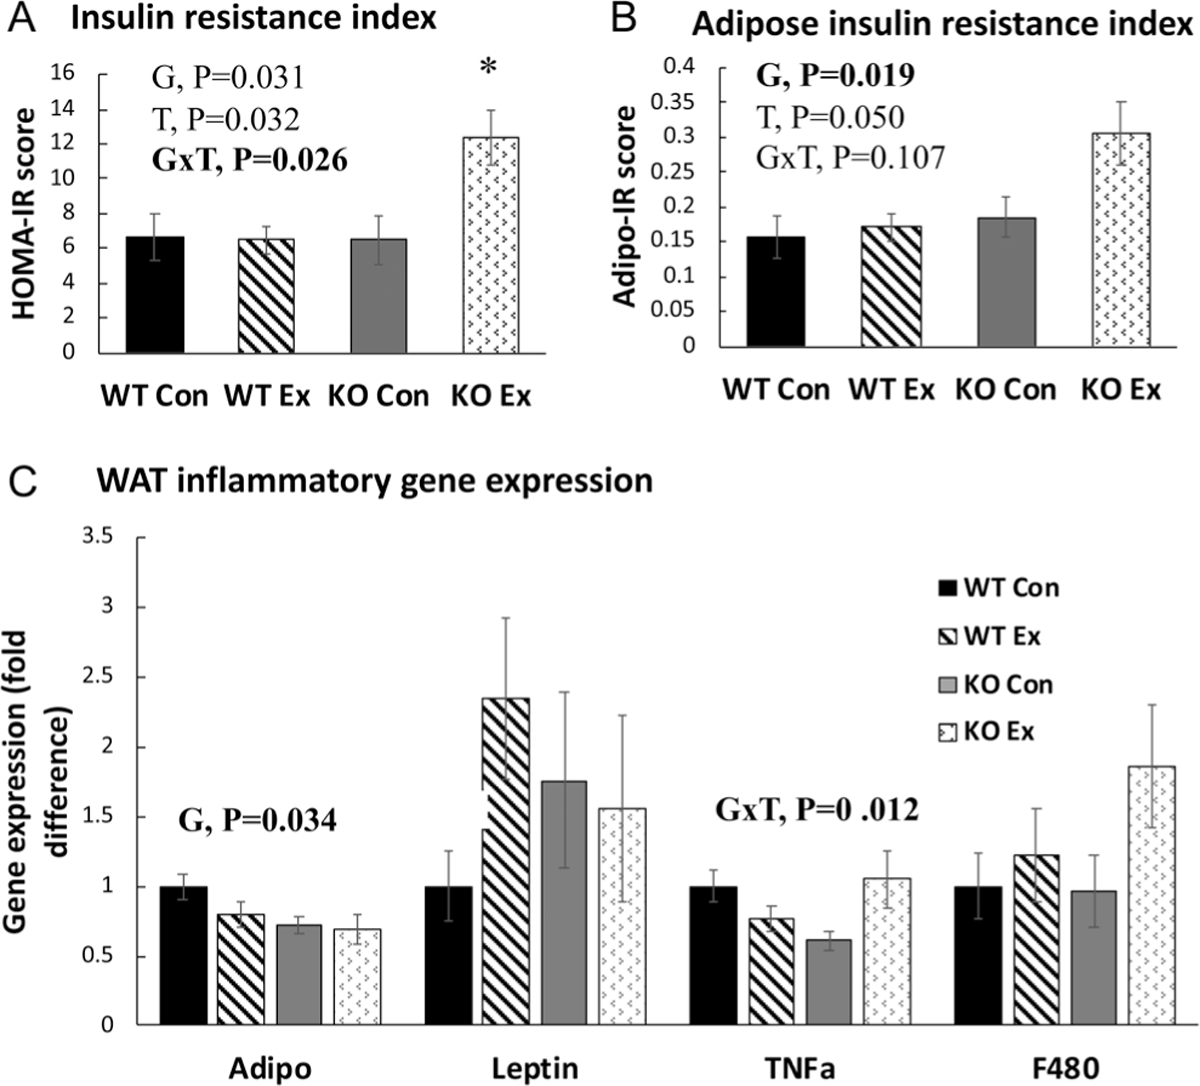
Insulin resistance (IR) and adipose tissue inflammatory gene expression. (A) HOMA-IR, calculated as the product of fasting blood glucose and plasma insulin levels. (B) Adipo-IR, calculated as the product of non-esterified fatty acid levels and plasma insulin levels. (C) Perigonadal white adipose tissue (PGAT) inflammatory gene expression. Adipo, adiponectin; TNFa, tumor necrosis factor alpha. Gene expression was normalized to the housekeeping gene beta-actin and then expressed relative to WT Con group. Error bars indicate S.E.M. P ≤ 0.05 was considered significant; non-significant P values were not shown. *KO Ex group was significantly different from the other groups. NWTCon = 11, NWTEx = 10, NKOCon = 10, NKOEx = 10. G, genotype effect; T, treatment effect; G×T, genotype × treatment interaction effect.