
Figure 7.
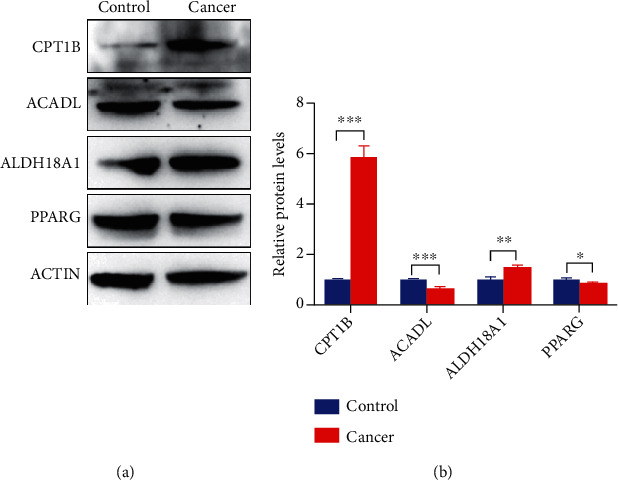
Western blotting analysis of four differentially expressed MMRGs in the signature model. The expression levels of CTP1B and ALDH18A1 protein were significantly upregulated in the tumor group, and the expression levels of ACADL and PPARG protein were slightly downregulated in the tumor group. Control: n = 3; and cancer: n = 3. ∗p < 0.05, ∗∗p < 0.01, and ∗∗∗p < 0.01.