FIGURE 2.
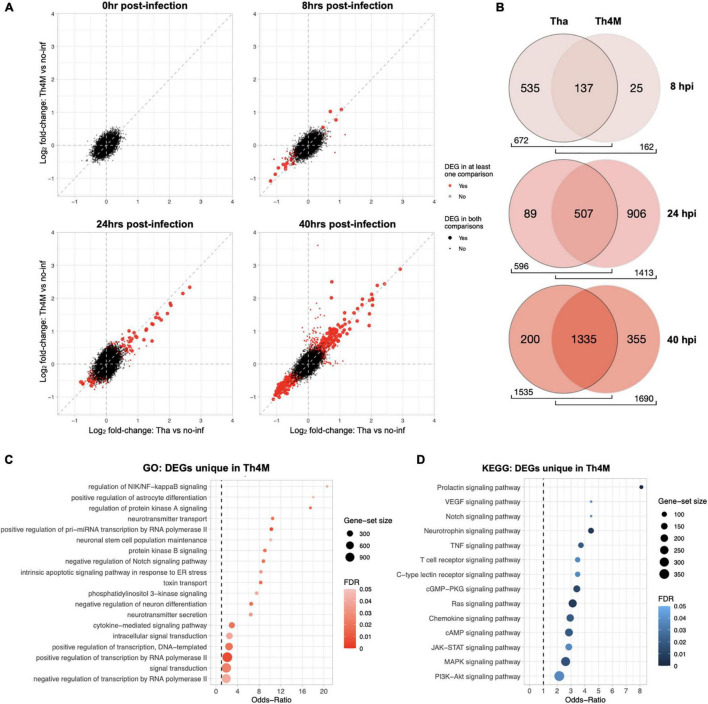
Comparison of Tha and Th4M dataset. (A) From 0 to 40 hpi, DEGs (in red) were progressively selected more at the later time points. The common DEGs between two datasets were marked with a larger dot in red, and DEGs unique to one dataset with a smaller dot in red. The exact number of DEGs can be referred to Table 1. (B) Th4M dataset shares the majority of associated GO terms (Biological Process) with Tha. As the number of DEGs increases over time, the shared GO terms take the majority of ontology proportion at each dataset. At 8 hpi, Th4M shares 85% of its GO terms with Tha, and at 24 hpi, Tha shares 85% of GO terms with Th4M due to their lower number of DEGs compare to the opponent. At 40 hpi, both datasets share over 79% of GO terms with the other. (C) The list of DEGs from all time-points that are only detected in Th4M dataset was crosschecked with the relevant GO term subset. Both the GO subset and DEG crosschecks are provided in Supplementary Table 6. (D) Crosscheck of unique DEGs in Th4M dataset with the relevant KEGG pathway subset.

