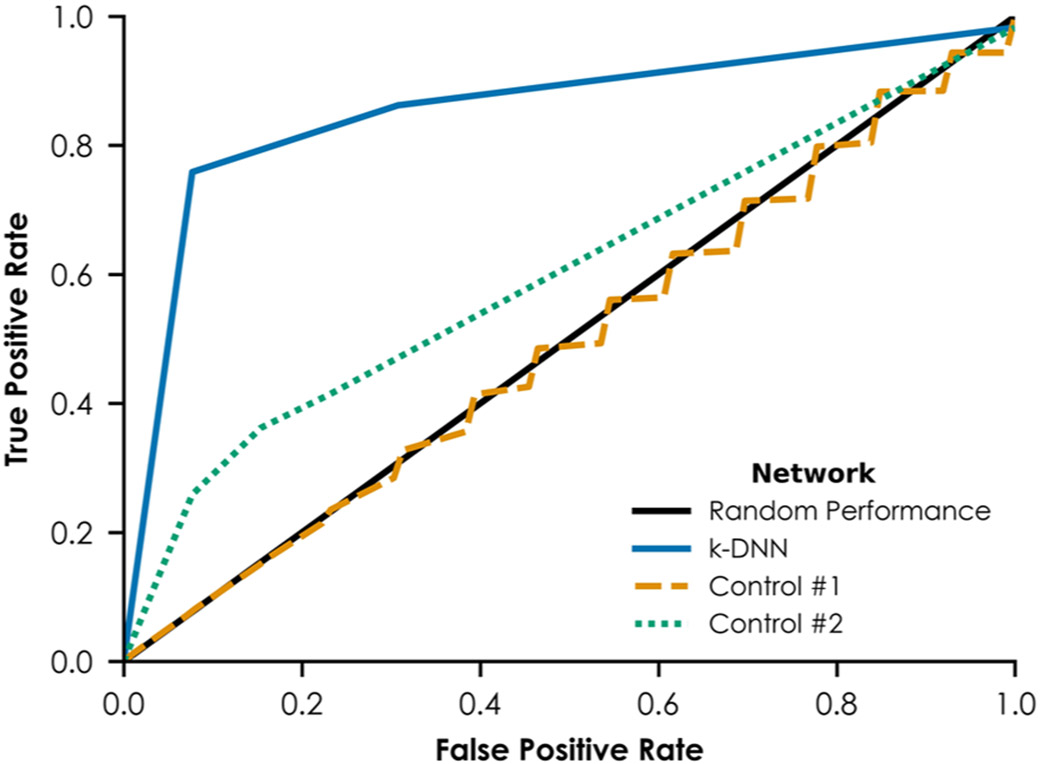
Figure 4.
ROCs from leave-one-out cross-validation. The solid line at y = x represents performance equivalent to assigning uterotrophic vs non-uterotrophic designations to compounds randomly. The solid curve represents the ROC for the k-DNN. The dashed line represents the ROC for the first control network, which was trained using 100 permutations of the in vitro bioassay and in vivo rodent uterotrophic training data. The dotted line represents the ROC for the second control network, which was trained without any bioassays known to encompass KEs in the nuclear ERα and ERβ AOP.

