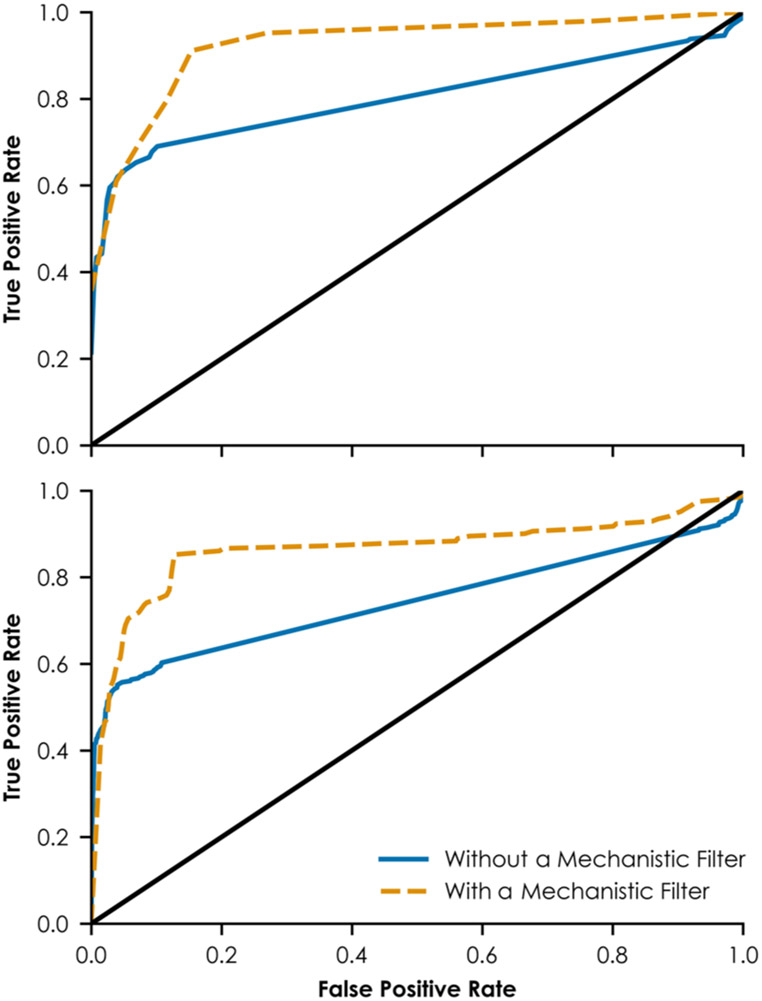
Figure 6.
ROCs from external validation. The top panel shows the ROC for the complete external validation set. The bottom panel shows the ROC for a subset of the external validation set containing only compounds experimentally untested in the HTS assays embedded in the network. The solid line at y = x in each panel represents performance equivalent to assigning estrogenic vs non-estrogenic designations to compounds randomly. In each panel, the solid curve represents the ROC for the complete data set using no mechanism-based filter. The dashed curve represents the ROC for a smaller subset that meets the mechanism-based criteria. Compounds that meet the mechanism-based criteria include predicted estrogens with at least three and predicted non-estrogens with no more than two network layers containing activated neurons related to nuclear ERα and ERβ signaling.

