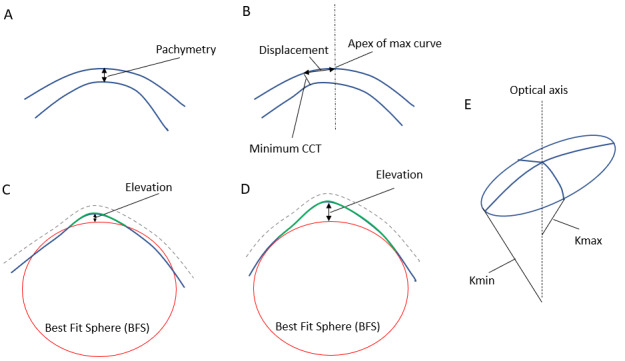
Figure 4.

Schematic diagram illustrating the 4 basic corneal parameters that can be measured using corneal imaging. (A) pachymetry. (B) displacement: distance between the apex of the cornea and the point of minimum thickness. (C) and (D) represent 2 methods of calculating the best-fit sphere (BFS). In (C) the BFS is fitted to both the normal peripheral posterior surface (blue) and the abnormal anterior protrusion of the central posterior surface (green). In (D) the BFS is fitted to only the normal peripheral posterior surface (blue) excluding the abnormal central posterior surface (green), leading to a larger relative elevation than in (C). (E) the smallest radius of curve of the astigmatic corneal surface corresponds to the largest refractive power (Kmax) and the largest radius of curve corresponds to the smallest refractive power (Kmin). CCT: central corneal thickness.
