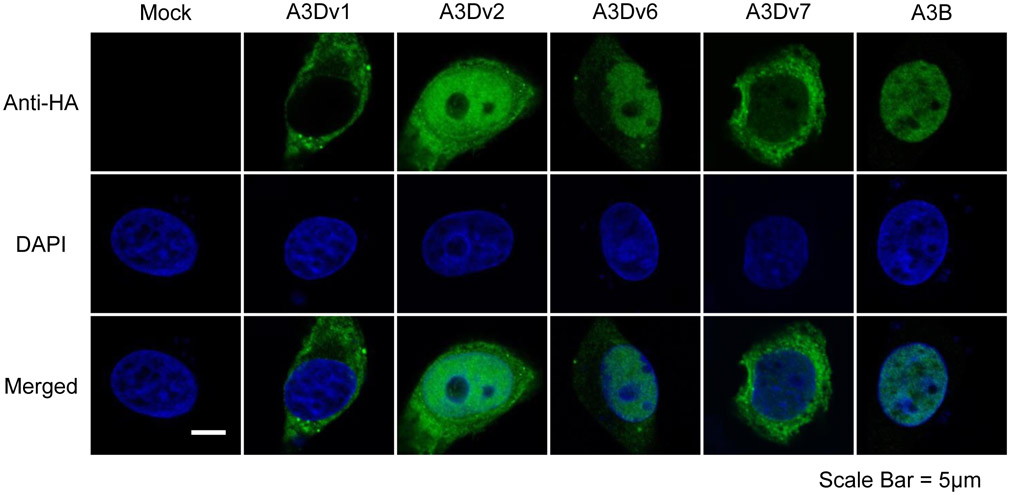
Figure 2. Subcellular localization of A3D variants and A3B in HeLa cells.
Confocal immunofluorescence images of HA-tagged A3 variants in transfected HeLa cells. HA-tagged A3s (top panels; green), nuclear stained with DAPI (middle panels; blue), and merged images (bottom panels) are shown. Scale bar = 5 μm.

