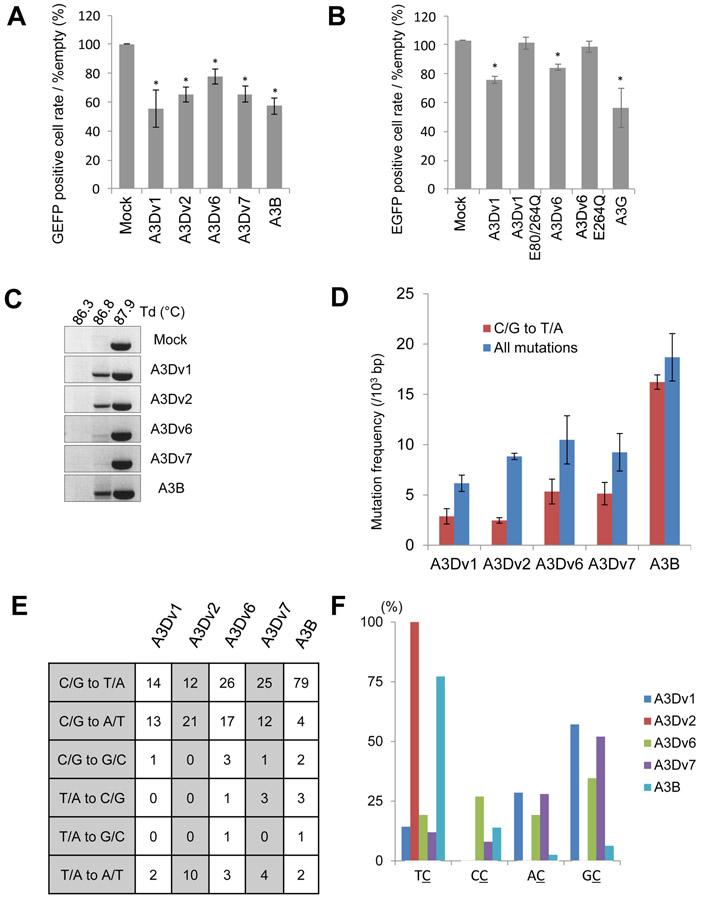
Figure 5. Foreign DNA editing assay by A3Ds and A3B.
(A) EGFP positive cell rates and (B) EGFP mean fluorescence intensity (MFI) compared to mock cells analyzed by flow cytometry 4 days after transfection in co-transfected HEK293T cells. Asterisks* on the error bar indicate P<0.05 (Student’s t-test). (C) Analysis of 3D-PCR products in HEK293T cells expressing A3D variants, A3B or empty as control. 3D-PCR for EGFP gene at indicated denaturation temperatures (Td) was performed. (D) Mutation frequencies in 3D-PCR products in HEK293T cells expressing A3D variants and A3B. 10 clones (4870 bps) were sequenced in each group. C/G to T/A mutation frequencies (blue bar) and mutation frequencies including all patterns (red bar) are shown. Error bars indicate S.E.M. (E) Mutation patterns of edited EGFP gene sequences derived from 3D-PCR products. (F) Dinucleotide patterns in edited EGFP gene. The rates of indicated dinucleotide sequence at C/G to T/A mutations.

