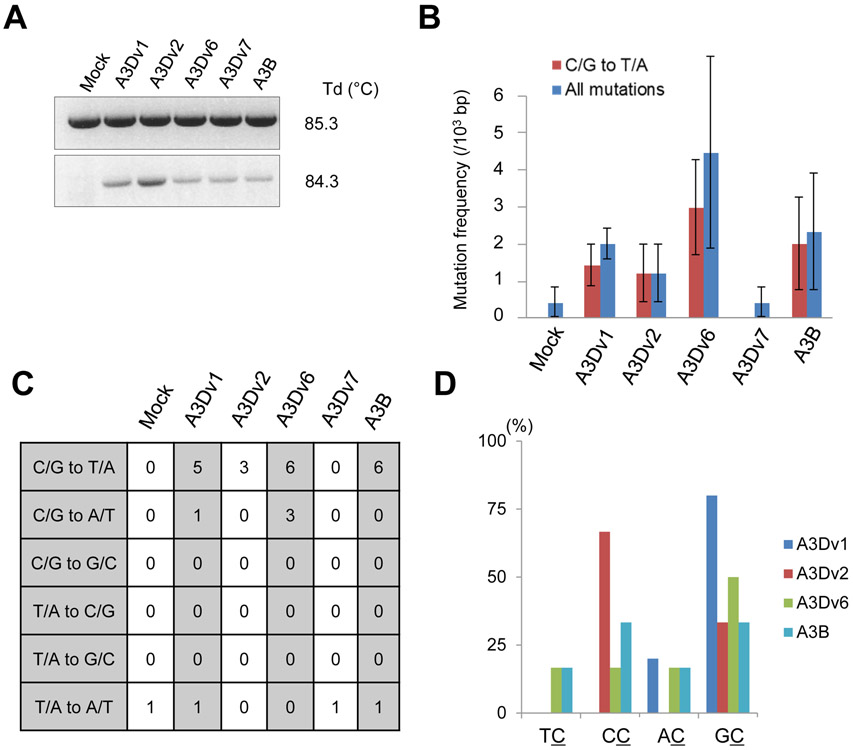
Figure 6. 3D-PCR for TP53 gene.
(A) Agarose gel analysis of 3D-PCR products in HEK293T cells stably expressing A3D variants, A3B or empty as control. 3D-PCR for TP53 gene at indicated Td was performed. (B) Mutation frequencies in 3D-PCR products in HEK293T cells stably expressing EGFP and A3D variants or A3B. Error bars indicate S.E.M. (C) Mutation patterns of edited TP53 gene sequences derived from 3D-PCR products. 5-7 clones (2500-3500 bps) were sequenced in each group. (D) Dinucleotide patterns in edited TP53 gene. The rates of indicated dinucleotide sequence at C/G to T/A mutations. A3Dv7 is not shown because no mutations were detected in cells expressing A3Dv7 in 3D-PCR for TP53 gene.

