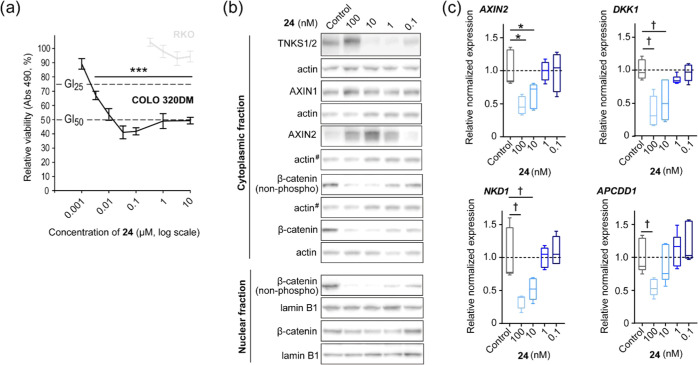
Figure 4.
Compound 24 decreased cell growth and inhibited WNT/β-catenin signaling activity in COLO 320DM cells. (a) 3-(4,5-Dimethylthiazol-2-yl)-5-(3-carboxymethoxyphenyl)-2-(4-sulfophenyl)-2H-tetrazolium (MTS) colorimetric cell growth assay for various doses of 24 in APCmutated COLO 320DM (black) and APCwild-type RKO (gray) cells. After 5 days, the antiproliferative effect of compound treatment was measured at 490 nm. Mean value ± standard deviation (SD) for one representative experiment of more than three repeated assays, each with six replicates, are shown. Dotted lines depict 50% (GI50-value) and 25% (GI25-value) growth inhibition levels and control = 100% (0.1% dimethyl sulfoxide (DMSO)). (b) Representative immunoblots of cytoplasmic TNKS1/2, AXIN1, AXIN2, and cytoplasmic and nuclear transcriptionally active β-catenin (non-phospho) and β-catenin. Actin and lamin B1 show equal protein loading, while # indicates that the same actin immunoblot is used as loading control for both AXIN2 and β-catenin. For (b) and (c), control = 0.001% DMSO. (c) Real-time RT-qPCR analyses of WNT/β-catenin signaling target genes (AXIN2, DKK1, NKD1, and APCDD1). Boxplots show median, first and third quartiles, and maximum and minimum whiskers for combined data from three independent experiments with three replicates each. Dotted lines depict the control mean value = 1. For (a) and (c), analysis of variance (ANOVA) tests (Holm–Sidak method, versus control) are indicated by *** (p < 0.001) and * (p < 0.05), while ANOVA on ranks tests (Dunn’s method, versus control) are indicated by † (p < 0.05).

