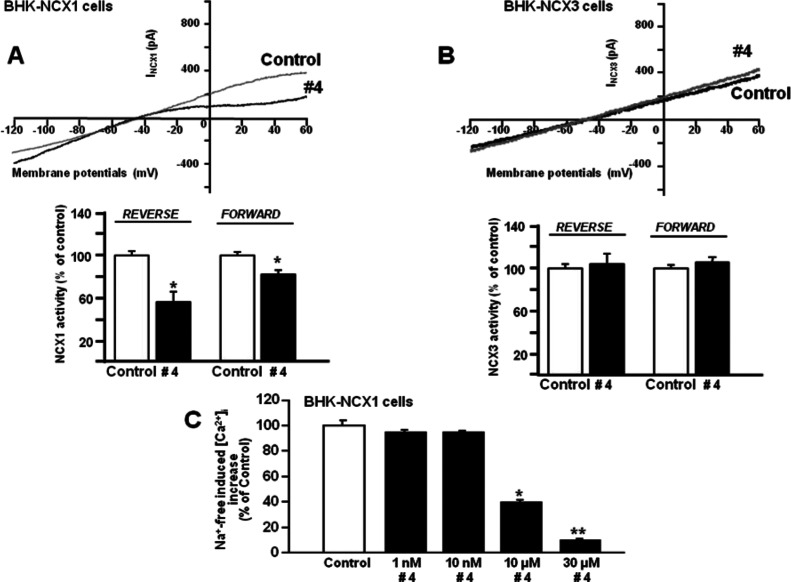
Figure 5.
Effect of compound 4 on NCX1 and NCX3 activity in BHK-NCX1 and BHK-NCX3 cells. (A) Representative INCX traces recorded in BHK-NCX1 by whole-cell patch-clamp electrophysiology in control cells and in cells treated with compound 4 (10 μM). The bar graphs in (A) report the mean ± SEM of the reverse and forward NCX1 current densities, respectively, measured in 10 cells for each experimental group. Reverse INCX amplitude was measured at +60 mV, while forward INCX was measured at −120 mV. *p < 0.05 vs each internal control. (B) Representative INCX traces recorded in BHK-NCX3 by whole-cell patch-clamp electrophysiology in control cells and in cells treated with compound 4 (10 μM). The bar graphs in (B) report the mean ± SEM of the reverse and forward NCX1 current densities, respectively, measured in 10 cells for each experimental group. Reverse INCX amplitude was measured at +60 mV, while forward INCX was measured at −120 mV. (C) Quantification of the concentration-dependent effect of compound 4 on Na+-free-induced [Ca2+]i increase through NCX1 reverse mode of operation in Fura-2-loaded BHK-NCX1 cells. The bar graph reports the mean ± SEM of the maximal [Ca2+]i responses measured in approximately 30 cells per group. Averaged data from four different experimental sessions were normalized as the percentage of controls. *p < 0.05 vs control, 1, and 1 0 nM; **p < 0.05 vs all.

